Mullica Hill: Fire Incidents, New Jersey (NJ)
Where are fire incidents reported in Mullica Hill, NJ
Something went wrong! Please refresh the page.
|
| |||||||||||||||||||||||||||||||||||||||||||||||||||||||||||||||||||||||||||||||||||||||||||||||||||||||||||||
2004 - 2018 National Fire Incident Reporting System (NFIRS) incidents
- Incident types reported to NFIRS in Mullica Hill, NJ
- 57127.2%Fire
- 52725.1%Hazardous Condition
- 46522.1%Good Intent Call
- 27112.9%False Alarm
- 1416.7%Rescue & EMS
- 1075.1%Service Call
- 100.5%Severe Weather
- 70.3%Overpressure Rupture
- 40.2%Special Incident
- Fire incident types reported to NFIRS in Mullica Hill, NJ
- 34259.9%Structure Fires
- 17230.1%Outside Fires
- 478.2%Mobile Property/Vehicle Fires
- 101.8%Other
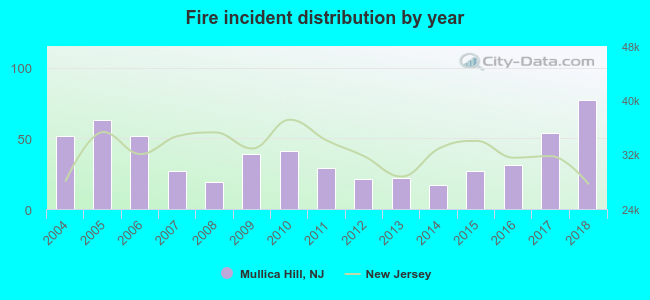 Based on the data from the years 2004 - 2018 the average number of fires per year is 38. The highest number of reported fires - 77 took place in 2018, and the least - 17 in 2014. The data has an increasing trend.
 The median response time based on all reported fire incidents is 9 minutes. This is higher than the New Jersey median value.
The median response time in Mullica Hill, NJ compared to nearest cities:
(Note: Based on data for all years, including only cities with at least 500 fire incidents)
| Mullica Hill: | 9 minutes |
| Glassboro: | 5 minutes |
| Paulsboro: | 8 minutes |
| Woodbury: | 7 minutes |
| Turnersville: | 7 minutes |
| Blackwood: | 6 minutes |
| Westville: | 6 minutes |
| Runnemede: | 7 minutes |
| Bellmawr: | 6 minutes |
 24.3% incidents where reported in the morning and 75.7% in the evening. The most fires (16.1%) took place on Friday, and the least (13.1%) on Saturday.
 Based on the 571 fire incident reports from years 2004 - 2018 most fires (11.9%) took place during April, and the least (5.6%) in September.
 Out of all 2,103 cases reported during the years 2004 - 2018, the most belonged to the categories: Fire (27.2%), Hazardous Condition (25.1%), and Good Intent Call (22.1%).
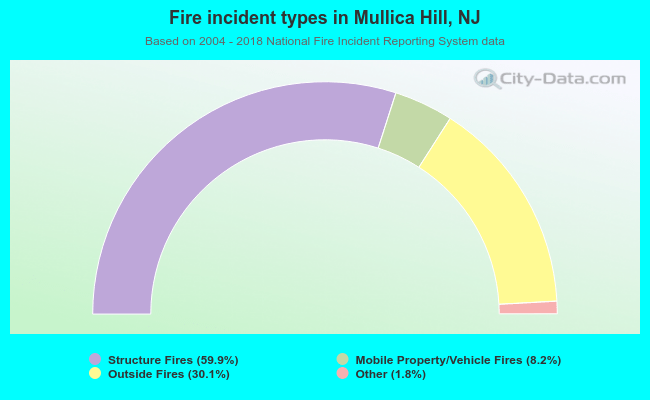 When looking into fire subcategories, the most reports belonged to: Structure Fires (59.9%), and Outside Fires (30.1%).