Oceano: Fire Incidents, California (CA)
Where are fire incidents reported in Oceano, CA
Something went wrong! Please refresh the page.
|
| |||||||||||||||||||||||||||||||||||||||||||||||||||||||||||||||||||||||||||||||||||||||||||||||||||||||||||||
2005 - 2018 National Fire Incident Reporting System (NFIRS) incidents
- Incident types reported to NFIRS in Oceano, CA
- 28639.6%Rescue & EMS
- 20928.9%Fire
- 10114.0%Good Intent Call
- 9813.6%Hazardous Condition
- 141.9%Service Call
- 141.9%False Alarm
- Fire incident types reported to NFIRS in Oceano, CA
- 10148.3%Outside Fires
- 4722.5%Mobile Property/Vehicle Fires
- 4320.6%Structure Fires
- 188.6%Other
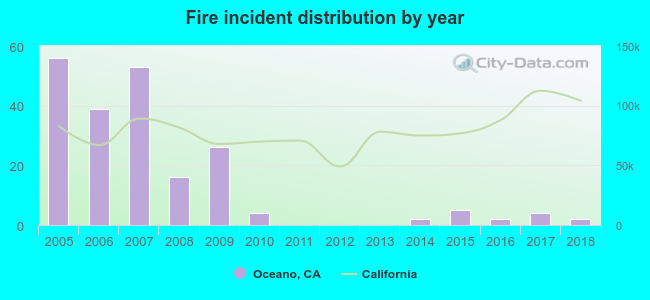 According to the data from the years 2005 - 2018 the average number of fire incidents per year is 15. The highest number of reported fires - 56 took place in 2005, and the least - 0 in 2011. The data has a dropping trend.
The average number of yearly fire incidents per 10k residents in Oceano, CA compared to nearest cities:
(Note: Based on data for the last 3 years, including only cities with population 5,000 and above)
| Oceano: | 3.7 |
| Grover Beach: | 0.7 |
| Arroyo Grande: | 3.5 |
| Pismo Beach: | 9.2 |
| Nipomo: | 18.1 |
| Guadalupe: | 29.8 |
| San Luis Obispo: | 13.2 |
| Santa Maria: | 28.3 |
| Orcutt: | 2.1 |
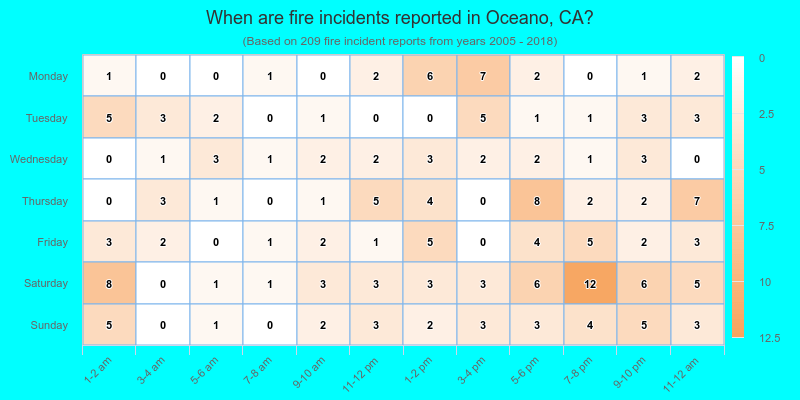
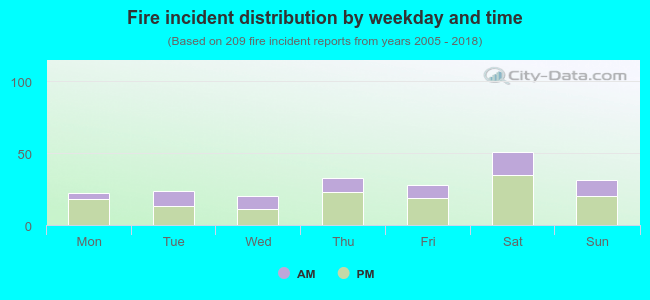 33.5% incidents where reported in the morning and 66.5% in the evening. The most fires (24.4%) took place on Saturday, and the least (9.6%) on Wednesday.
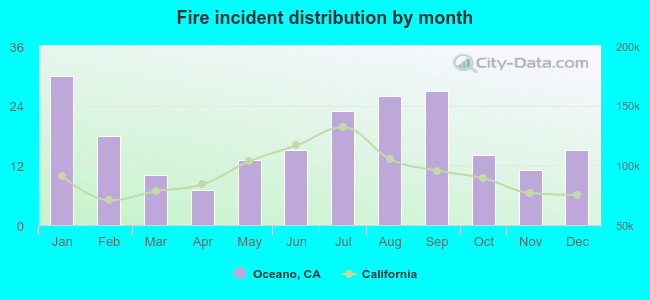 Based on the 209 reports from years 2005 - 2018 most fires (14.4%) took place during January, and the least (3.3%) in April.
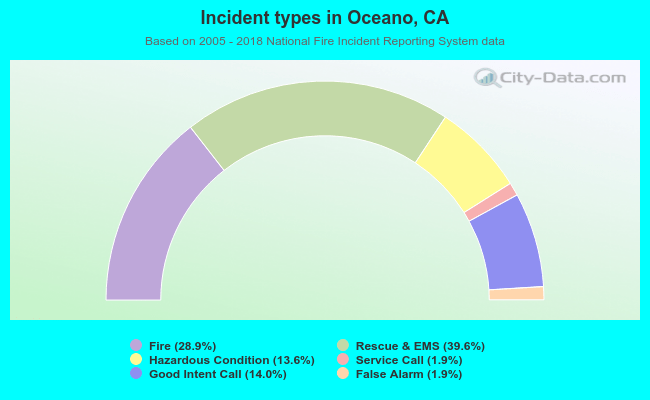 Out of all 722 cases reported during the years 2005 - 2018, the most belonged to the categories: Overpressure Rupture (39.6%), Fire (28.9%), and Service Call (14.0%).
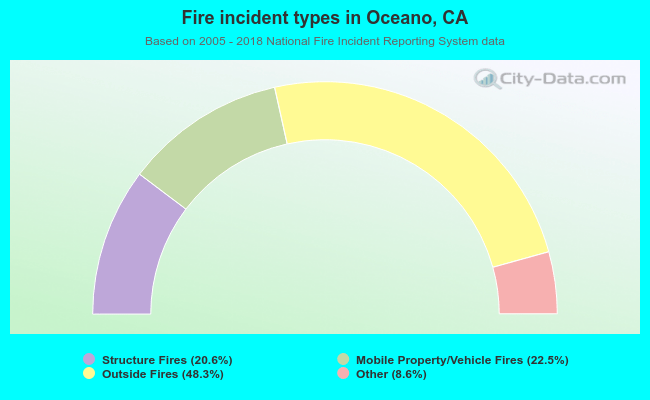 When looking into fire subcategories, the most reports belonged to: Outside Fires (48.3%), and Mobile Property/Vehicle Fires (22.5%).