Oshkosh: Fire Incidents, Wisconsin (WI)
Where are fire incidents reported in Oshkosh, WI
Something went wrong! Please refresh the page.
| Fire incidents reported | |
|---|---|
| Sreet name | Count |
| MAIN ST | 50 |
| WASHBURN ST | 38 |
| JACKSON ST | 32 |
| HIGH AVE | 26 |
| ALGOMA BLVD | 24 |
| COURT ST | 24 |
| OREGON ST | 24 |
| 20TH AVE | 20 |
| KOELLER ST | 20 |
| WESTHAVEN DR | 20 |
| 9TH AVE | 18 |
| BOWEN ST | 18 |
| GROVE ST | 18 |
| 45 HWY | 14 |
| 6TH AVE | 14 |
| ELMWOOD AVE | 14 |
| EVANS ST | 14 |
| HWY 21 | 14 |
| IRVING AVE | 14 |
| MARICOPA DR | 14 |
| MERRITT AVE | 14 |
| OHIO ST | 14 |
| WISCONSIN ST | 14 |
| CTY TK Y | 12 |
| JEFFERSON ST | 12 |
| OAKWOOD RD | 12 |
| SNELL RD | 12 |
| WASHINGTON AVE | 12 |
| WESTFIELD ST | 12 |
| WESTOWNE AVE | 12 |
| Other | 350 |
2003 - 2018 National Fire Incident Reporting System (NFIRS) incidents
- Incident types reported to NFIRS in Oshkosh, WI
- 19,19478.5%Rescue & EMS
- 2,0038.2%False Alarm
- 1,0764.4%Hazardous Condition
- 9063.7%Fire
- 6812.8%Service Call
- 4962.0%Good Intent Call
- 440.2%Overpressure Rupture
- 310.1%Special Incident
- Fire incident types reported to NFIRS in Oshkosh, WI
- 44749.3%Structure Fires
- 24126.6%Outside Fires
- 16918.7%Mobile Property/Vehicle Fires
- 495.4%Other
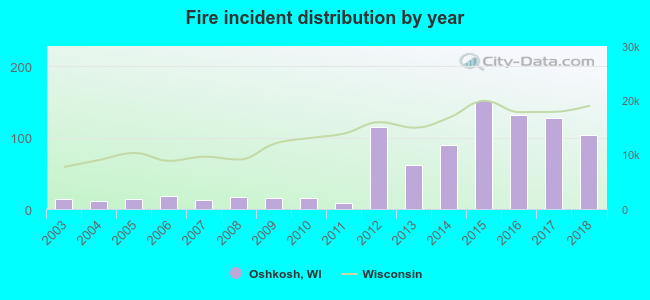 Based on the data from the years 2003 - 2018 the average number of fire incidents per year is 56. The highest number of reported fires - 152 took place in 2015, and the least - 8 in 2011. The data has an increasing trend.
The average number of yearly fire incidents per 10k residents in Oshkosh, WI compared to nearest cities:
(Note: Based on data for the last 3 years, including only cities with population 5,000 and above)
| Oshkosh: | 18.1 |
| Neenah: | 32.4 |
| Menasha: | 31.6 |
| North Fond du Lac: | 20.6 |
| Harrison: | 9.8 |
| Fond du Lac: | 34.1 |
| Appleton: | 17.6 |
| Grand Chute: | 32.3 |
| Greenville: | 20.4 |
 The median response time based on all reported fire incidents is 5 minutes. This is lower compared to the state median value.
The median response time in Oshkosh, WI compared to nearest cities:
(Note: Based on data for all years, including only cities with at least 500 fire incidents)
| Oshkosh: | 5 minutes |
| Neenah: | 5 minutes |
| Menasha: | 5 minutes |
| Fond du Lac: | 5 minutes |
| Appleton: | 5 minutes |
| Grand Chute: | 5 minutes |
| Kaukauna: | 6 minutes |
 According to the data from the years 2003 - 2018 the average number of fire-related casualties per year is 2. The highest number of reported injuries - 8 took place in 2012, and the lowest - 0 in 2003. The data has a constant trend.
The average number of injuries per 1,000 fire incidents is 14. This indicator was the highest - 70 in 2012, and the lowest 0 in 2003. The trend for injuries per 1,000 fire incidents is constant. Compared to the state value the number of casualties per 1,000 incidents is much higher.
According to the data from the years 2003 - 2018 the average number of fire-related casualties per year is 2. The highest number of reported injuries - 8 took place in 2012, and the lowest - 0 in 2003. The data has a constant trend.
The average number of injuries per 1,000 fire incidents is 14. This indicator was the highest - 70 in 2012, and the lowest 0 in 2003. The trend for injuries per 1,000 fire incidents is constant. Compared to the state value the number of casualties per 1,000 incidents is much higher.Casualties per 1,000 incidents in Oshkosh, WI compared to nearest cities:
(Note: Based on data for all years, including only cities with at least 500 fire incidents)
| Oshkosh: | 29.8 |
| Neenah: | 13.2 |
| Menasha: | 24.7 |
| Fond du Lac: | 4.7 |
| Appleton: | 25.2 |
| Grand Chute: | 35.1 |
| Kaukauna: | 22.8 |
 32.7% incidents where reported in the morning and 67.3% in the evening. The most fires (15.1%) took place on Tuesday, and the least (13.6%) on Wednesday.
 Based on the 906 fires from years 2003 - 2018 most fires (11.9%) took place during May, and the least (5.8%) in February.
 Out of all 24,439 cases reported during the years 2003 - 2018, the most belonged to the categories: Rescue & EMS (78.5%), False Alarm (8.2%), and Hazardous Condition (4.4%).
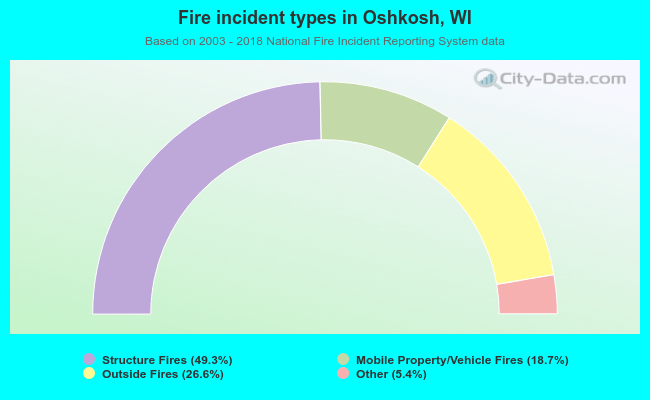 When looking into fire subcategories, the most reports belonged to: Structure Fires (49.3%), and Outside Fires (26.6%).