Palisades Park: Fire Incidents, New Jersey (NJ)
Where are fire incidents reported in Palisades Park, NJ
Something went wrong! Please refresh the page.
| Fire incidents reported | |
|---|---|
| Sreet name | Count |
| BROAD AVE | 262 |
| COLUMBIA AVE | 104 |
| BERGEN BLVD | 90 |
| GRAND AVE | 86 |
| HARRIET AVE | 54 |
| CENTRAL BLVD | 46 |
| PALISADES BLVD | 44 |
| HENRY AVE | 42 |
| HIGHLAND AVE | 40 |
| 12TH ST | 34 |
| ROFF AVE | 28 |
| COMMERCIAL AVE | 26 |
| HOMESTEAD AVE | 26 |
| 2ND ST | 24 |
| BROAD AV | 24 |
| 3RD ST | 22 |
| EDSALL BLVD | 22 |
| 8TH ST | 20 |
| 9TH ST | 20 |
| GLEN AVE | 20 |
| GRANTWOOD BLVD | 20 |
| RUBY AVE | 20 |
| 7TH ST | 18 |
| BRINKERHOFF AVE | 18 |
| HILLSIDE AVE | 18 |
| 1ST ST | 16 |
| BERGEN BL | 16 |
| LINCOLN ST | 16 |
| ROUTE 46 | 16 |
| 4TH ST | 14 |
2004 - 2018 National Fire Incident Reporting System (NFIRS) incidents
- Incident types reported to NFIRS in Palisades Park, NJ
- 1,48542.6%Hazardous Condition
- 81023.2%False Alarm
- 80823.2%Fire
- 2627.5%Service Call
- 581.7%Good Intent Call
- 561.6%Rescue & EMS
- 40.1%Overpressure Rupture
- Fire incident types reported to NFIRS in Palisades Park, NJ
- 56870.3%Structure Fires
- 17721.9%Outside Fires
- 516.3%Mobile Property/Vehicle Fires
- 121.5%Other
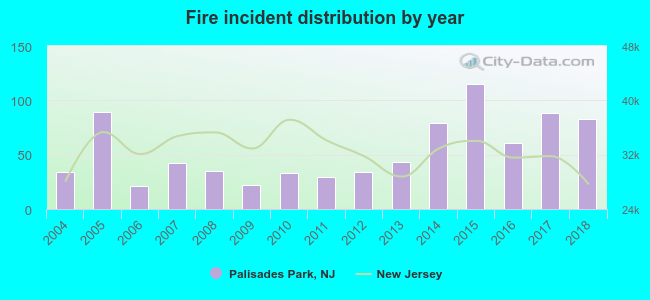 According to the data from the years 2004 - 2018 the average number of fire incidents per year is 54. The highest number of reported fire incidents - 115 took place in 2015, and the least - 21 in 2006. The data has a rising trend.
The average number of yearly fire incidents per 10k residents in Palisades Park, NJ compared to nearest cities:
(Note: Based on data for the last 3 years, including only cities with population 5,000 and above)
| Palisades Park: | 37.8 |
| Ridgefield: | 38.7 |
| Fort Lee: | 43.8 |
| Leonia: | 53.6 |
| Edgewater: | 39.4 |
| Cliffside Park: | 53.6 |
| Ridgefield Park: | 30.3 |
| Fairview: | 16.3 |
| Little Ferry: | 19.0 |
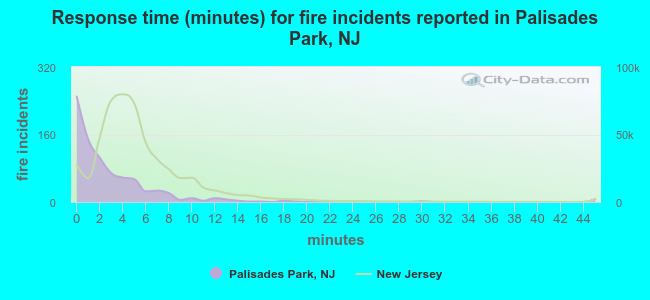 The median response time based on all reported fire incidents is 2 minutes. This is much lower compared to the state median value.
The median response time in Palisades Park, NJ compared to nearest cities:
(Note: Based on data for all years, including only cities with at least 500 fire incidents)
| Palisades Park: | 2 minutes |
| Ridgefield: | 3 minutes |
| Fort Lee: | 4 minutes |
| Leonia: | 3 minutes |
| Edgewater: | 3 minutes |
| Cliffside Park: | 5 minutes |
| Teaneck: | 3 minutes |
| Englewood: | 4 minutes |
| Hackensack: | 3 minutes |
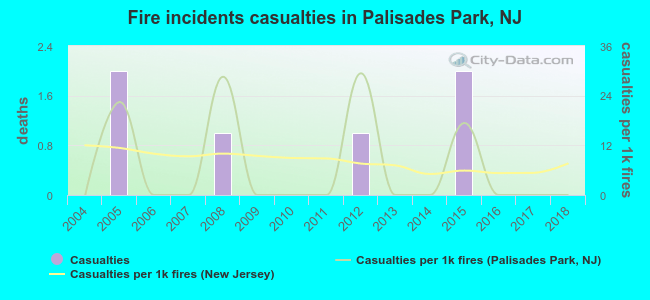 Based on the reports from the years 2004 - 2018 the average number of fire-related casualties per year is 0. The highest number of reported injuries - 2 took place in 2005, and the lowest - 0 in 2004. The data has a constant trend.
The average number of casualties per 1,000 fire incidents is 7. This indicator was the highest - 29 in 2012, and the lowest 0 in 2004. The trend for injuries per 1,000 fires is constant. Compared to the New Jersey value the number of injuries per 1,000 fire incidents is about the same.
Based on the reports from the years 2004 - 2018 the average number of fire-related casualties per year is 0. The highest number of reported injuries - 2 took place in 2005, and the lowest - 0 in 2004. The data has a constant trend.
The average number of casualties per 1,000 fire incidents is 7. This indicator was the highest - 29 in 2012, and the lowest 0 in 2004. The trend for injuries per 1,000 fires is constant. Compared to the New Jersey value the number of injuries per 1,000 fire incidents is about the same.Casualties per 1,000 incidents in Palisades Park, NJ compared to nearest cities:
(Note: Based on data for all years, including only cities with at least 500 fire incidents)
| Palisades Park: | 7.4 |
| Ridgefield: | 7.6 |
| Fort Lee: | 18.4 |
| Leonia: | 1.4 |
| Edgewater: | 0.0 |
| Cliffside Park: | 4.7 |
| Teaneck: | 11.1 |
| Englewood: | 6.3 |
| Hackensack: | 13.1 |
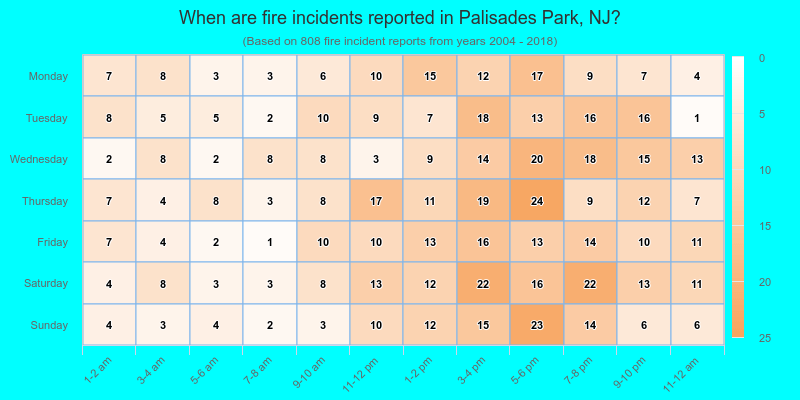
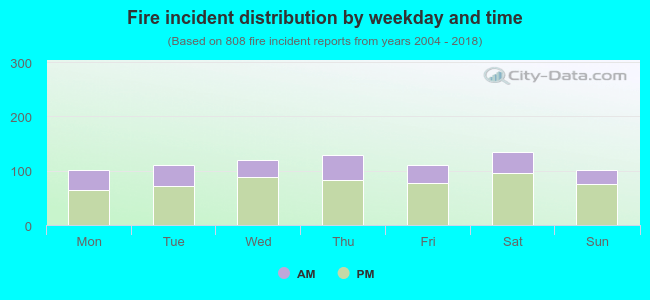 31.3% incidents where reported in the morning and 68.7% in the evening. The most fires (16.7%) took place on Saturday, and the least (12.5%) on Monday.
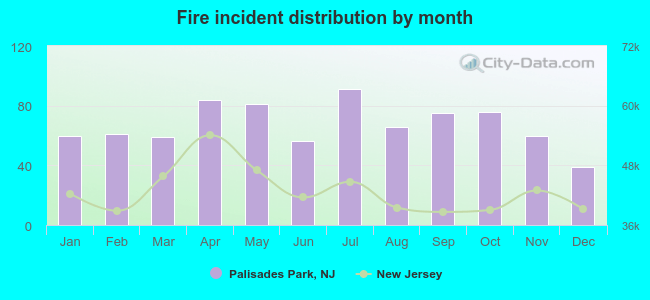 According to the 808 fire incident reports from years 2004 - 2018 most fires (11.3%) took place during July, and the least (4.8%) in December.
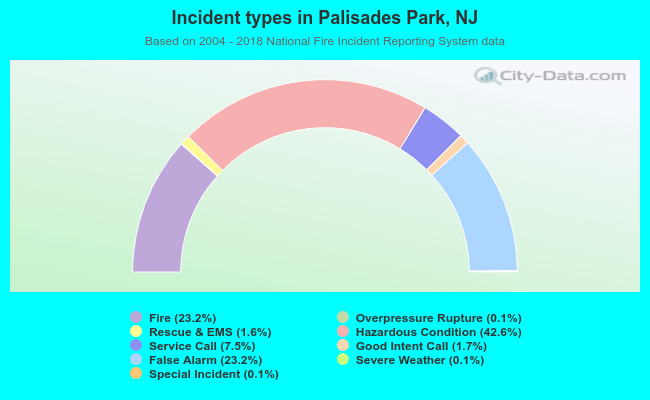 Out of all 3,489 cases reported during the years 2004 - 2018, the most belonged to the categories: Hazardous Condition (42.6%), False Alarm (23.2%), and Fire (23.2%).
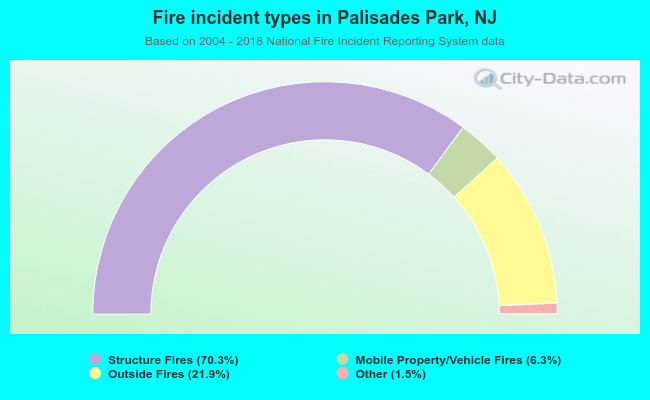 When looking into fire subcategories, the most incidents belonged to: Structure Fires (70.3%), and Outside Fires (21.9%).