Pelham: Fire Incidents, Alabama (AL)
Where are fire incidents reported in Pelham, AL
Something went wrong! Please refresh the page.
| Fire incidents reported | |
|---|---|
| Sreet name | Count |
| INTERSTATE 65 FWY | 502 |
| PELHAM PKWY | 280 |
| CAHABA VALLEY RD | 130 |
| PELHAM | 105 |
| HIGHWAY 52 CNTY | 90 |
| GREENPARK SOUTH MHP | 75 |
| HIGHWAY 11 CNTY | 59 |
| HIGH CREST RD | 55 |
| HELENA RD | 50 |
| PELHAM PKY | 49 |
| PARDUE RD | 45 |
| CROSSCREEK TRL | 40 |
| HIGHWAY 33 CNTY | 40 |
| HUNTLEY APARTMENT DR | 40 |
| HIGHWAY 11 | 30 |
| HIGHWAY 35 CNTY | 30 |
| INDUSTRIAL PARK DR | 30 |
| OLD MONTGOMERY HWY | 30 |
| CHANDALAR CT | 25 |
| CHANDAWAY DR | 25 |
| HIGHWAY 35 | 25 |
| HIGHWAY 72 CNTY | 25 |
| HUNTLEY PKY | 25 |
| HWY 35 | 25 |
| INDIAN LANDING RD | 25 |
| KELLY DR | 25 |
| LITTLE MOUNTAIN CIR | 25 |
| MCCAIN PKY | 25 |
| OVERHILL DR | 25 |
| STATE PARK RD | 25 |
2006 - 2018 National Fire Incident Reporting System (NFIRS) incidents
- Incident types reported to NFIRS in Pelham, AL
- 7,29664.2%Rescue & EMS
- 1,23310.8%Service Call
- 9078.0%Fire
- 8097.1%False Alarm
- 5534.9%Hazardous Condition
- 3963.5%Good Intent Call
- 1461.3%Special Incident
- 150.1%Overpressure Rupture
- Fire incident types reported to NFIRS in Pelham, AL
- 47652.5%Outside Fires
- 21323.5%Structure Fires
- 18820.7%Mobile Property/Vehicle Fires
- 303.3%Other
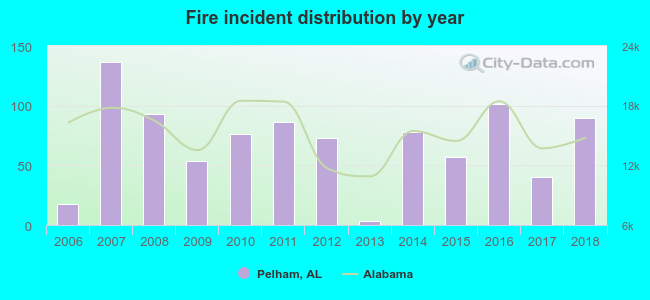 Based on the data from the years 2006 - 2018 the average number of fires per year is 70. The highest number of fires - 137 took place in 2007, and the least - 3 in 2013. The data has a growing trend.
The average number of yearly fire incidents per 10k residents in Pelham, AL compared to nearest cities:
(Note: Based on data for the last 3 years, including only cities with population 5,000 and above)
| Pelham: | 33.9 |
| Helena: | 3.4 |
| Alabaster: | 26.4 |
| Hoover: | 8.0 |
| Chelsea: | 40.3 |
| Vestavia Hills: | 20.2 |
| Homewood: | 35.3 |
| Bessemer: | 92.8 |
| Mountain Brook: | 11.4 |
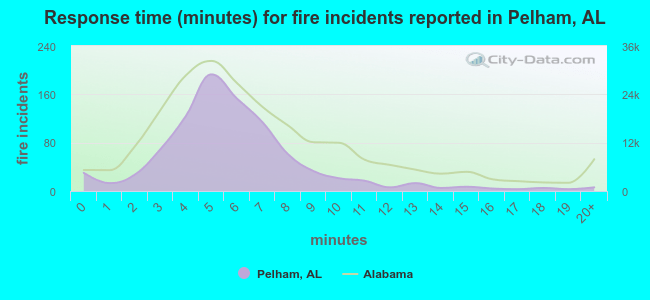 The median response time based on all reported fire incidents is 5 minutes. This is lower than the Alabama median value.
The median response time in Pelham, AL compared to nearest cities:
(Note: Based on data for all years, including only cities with at least 500 fire incidents)
| Pelham: | 5 minutes |
| Alabaster: | 6 minutes |
| Hoover: | 5 minutes |
| Vestavia Hills: | 4 minutes |
| Homewood: | 6 minutes |
| Bessemer: | 5 minutes |
| Midfield: | 5 minutes |
| Calera: | 6 minutes |
| Birmingham: | 6 minutes |
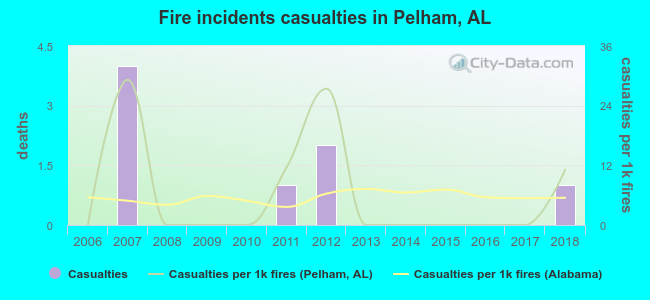 According to the reports from the years 2006 - 2018 the average number of fire-related yearly casualties is 1. The highest number of casualties - 4 took place in 2007, and the lowest - 0 in 2006. The data has a growing trend.
The average number of injuries per 1,000 fires is 6. This indicator was the highest - 29 in 2007, and the lowest 0 in 2006. The trend for injuries per 1,000 fire incidents is growing. Compared to the Alabama value the number of casualties per 1,000 fire incidents is higher.
According to the reports from the years 2006 - 2018 the average number of fire-related yearly casualties is 1. The highest number of casualties - 4 took place in 2007, and the lowest - 0 in 2006. The data has a growing trend.
The average number of injuries per 1,000 fires is 6. This indicator was the highest - 29 in 2007, and the lowest 0 in 2006. The trend for injuries per 1,000 fire incidents is growing. Compared to the Alabama value the number of casualties per 1,000 fire incidents is higher.Casualties per 1,000 incidents in Pelham, AL compared to nearest cities:
(Note: Based on data for all years, including only cities with at least 500 fire incidents)
| Pelham: | 8.8 |
| Alabaster: | 14.4 |
| Hoover: | 9.0 |
| Vestavia Hills: | 19.5 |
| Homewood: | 3.9 |
| Bessemer: | 5.0 |
| Midfield: | 0.0 |
| Calera: | 1.1 |
| Birmingham: | 5.1 |
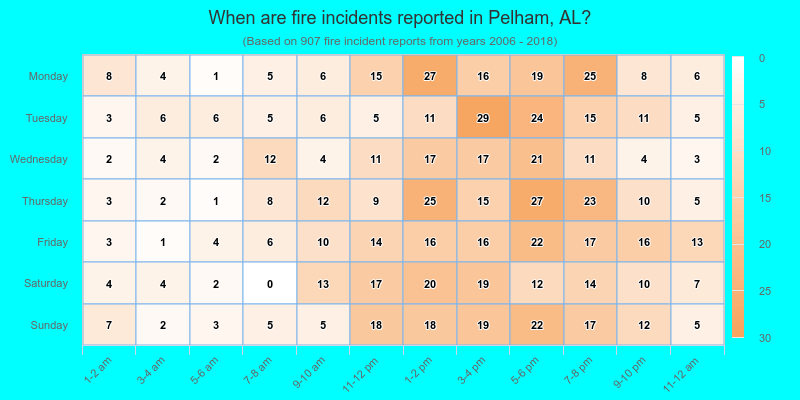
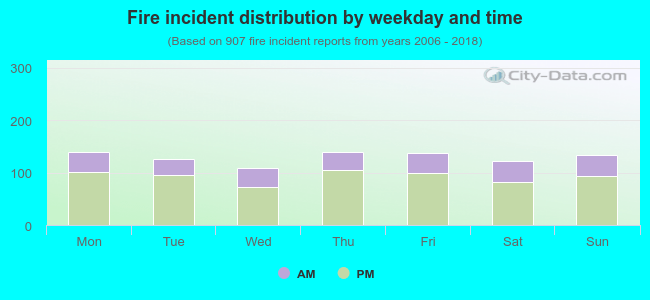 28.4% incidents where reported in the morning and 71.6% in the evening. The most fires (15.4%) took place on Monday, and the least (11.9%) on Wednesday.
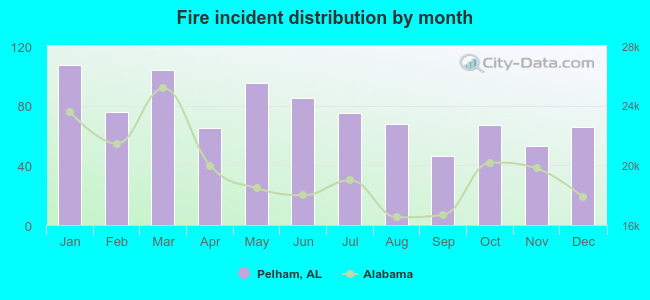 Based on the 907 fire incidents from years 2006 - 2018 most fires (11.8%) took place during January, and the least (5.1%) in September.
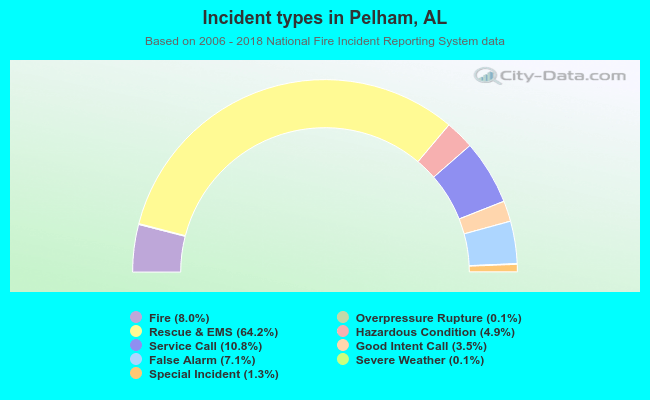 Out of all 11,365 cases reported during the years 2006 - 2018, the most belonged to the categories: Rescue & EMS (64.2%), Service Call (10.8%), and Fire (8.0%).
 When looking into fire subcategories, the most incidents belonged to: Outside Fires (52.5%), and Structure Fires (23.5%).