Penns Grove: Fire Incidents, New Jersey (NJ)
Where are fire incidents reported in Penns Grove, NJ
Something went wrong! Please refresh the page.
|
| |||||||||||||||||||||||||||||||||||||||||||||||||||||||||||||||||||||||||||||||||||||||||||||||||||||||||||||
2003 - 2018 National Fire Incident Reporting System (NFIRS) incidents
- Incident types reported to NFIRS in Penns Grove, NJ
- 55352.9%Fire
- 22521.5%Hazardous Condition
- 11110.6%False Alarm
- 737.0%Good Intent Call
- 666.3%Rescue & EMS
- 171.6%Service Call
- Fire incident types reported to NFIRS in Penns Grove, NJ
- 42075.9%Structure Fires
- 6511.8%Outside Fires
- 498.9%Mobile Property/Vehicle Fires
- 193.4%Other
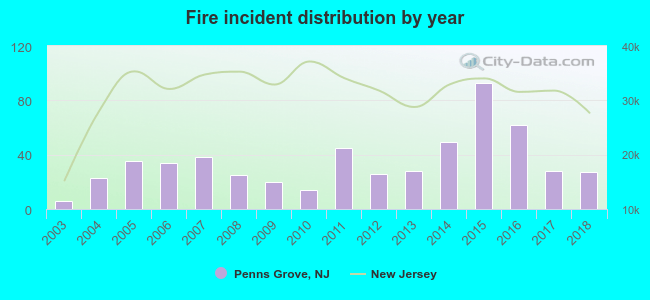 According to the data from the years 2003 - 2018 the average number of fire incidents per year is 35. The highest number of fire incidents - 93 took place in 2015, and the least - 6 in 2003. The data has an increasing trend.
The average number of yearly fire incidents per 10k residents in Penns Grove, NJ compared to nearest cities:
(Note: Based on data for the last 3 years, including only cities with population 5,000 and above)
| Penns Grove: | 77.9 |
| Carneys Point: | 32.5 |
| Pennsville: | 28.3 |
| Paulsboro: | 76.8 |
 The median response time based on all reported fire incidents is 9 minutes. This is higher compared to the state median value.
The median response time in Penns Grove, NJ compared to nearest cities:
(Note: Based on data for all years, including only cities with at least 500 fire incidents)
| Penns Grove: | 9 minutes |
| Carneys Point: | 9 minutes |
| Wilmington: | 6 minutes |
| Claymont: | 6 minutes |
| Pennsville: | 7 minutes |
| New Castle: | 7 minutes |
| Salem: | 7 minutes |
| Hockessin: | 8 minutes |
| Delaware City: | 8 minutes |
 34.7% incidents where reported in the morning and 65.3% in the evening. The most fires (18.8%) took place on Saturday, and the least (11.4%) on Friday.
 Based on the 553 fires from years 2003 - 2018 most fires (12.7%) took place during November, and the least (4.7%) in December.
 Out of all 1,045 cases reported during the years 2003 - 2018, the most belonged to the categories: Fire (52.9%), Rescue & EMS (21.5%), and Good Intent Call (10.6%).
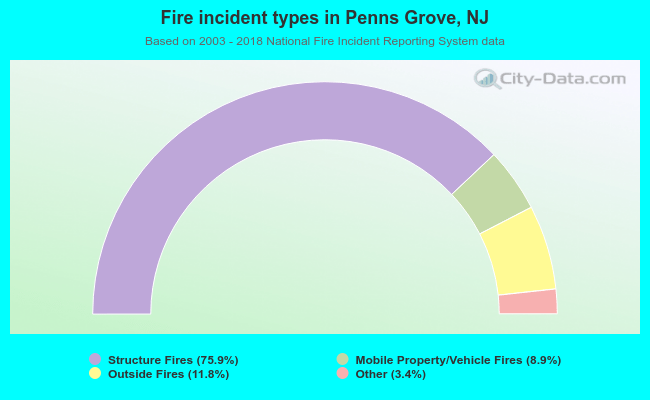 When looking into fire subcategories, the most incidents belonged to: Structure Fires (75.9%), and Outside Fires (11.8%).