Pitman: Fire Incidents, New Jersey (NJ)
Where are fire incidents reported in Pitman, NJ
Something went wrong! Please refresh the page.
|
| |||||||||||||||||||||||||||||||||||||||||||||||||||||||||||||||||||||||||||||||||||||||||||||||||||||||||||||
2004 - 2018 National Fire Incident Reporting System (NFIRS) incidents
- Incident types reported to NFIRS in Pitman, NJ
- 66535.7%Hazardous Condition
- 42022.5%Fire
- 35318.9%False Alarm
- 1729.2%Good Intent Call
- 1317.0%Service Call
- 935.0%Rescue & EMS
- 191.0%Special Incident
- 80.4%Severe Weather
- 30.2%Overpressure Rupture
- Fire incident types reported to NFIRS in Pitman, NJ
- 26563.1%Structure Fires
- 10926.0%Outside Fires
- 337.9%Other
- 133.1%Mobile Property/Vehicle Fires
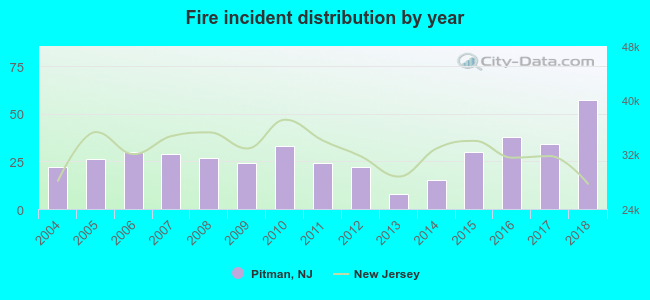 According to the data from the years 2004 - 2018 the average number of fire incidents per year is 28. The highest number of fires - 57 took place in 2018, and the least - 8 in 2013. The data has a growing trend.
The average number of yearly fire incidents per 10k residents in Pitman, NJ compared to nearest cities:
(Note: Based on data for the last 3 years, including only cities with population 5,000 and above)
| Pitman: | 48.3 |
| Glassboro: | 55.6 |
| Clayton: | 9.6 |
| Woodbury: | 68.6 |
| Williamstown: | 24.6 |
| Pine Hill: | 69.8 |
| Runnemede: | 46.2 |
| Stratford: | 51.4 |
| Paulsboro: | 76.8 |

 According to the data from the years 2004 - 2018 the average number of fire-related yearly casualties is 0. The highest number of injuries - 2 took place in 2018, and the lowest - 0 in 2004. The data has an increasing trend.
 31.0% incidents where reported in the morning and 69.0% in the evening. The most fires (17.9%) took place on Sunday, and the least (11.9%) on Friday.
 Based on the 420 fire incident reports from years 2004 - 2018 most fires (10.5%) took place during January, and the least (6.4%) in February.
 Out of all 1,864 cases reported during the years 2004 - 2018, the most belonged to the categories: Hazardous Condition (35.7%), Fire (22.5%), and False Alarm (18.9%).
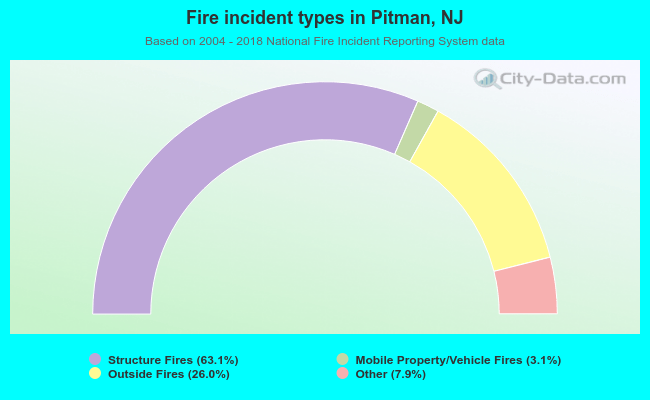 When looking into fire subcategories, the most incidents belonged to: Structure Fires (63.1%), and Outside Fires (26.0%).