Plymouth: Fire Incidents, Minnesota (MN)
Where are fire incidents reported in Plymouth, MN
Something went wrong! Please refresh the page.
| Fire incidents reported | |
|---|---|
| Sreet name | Count |
| LANCASTER LA N | 308 |
| NATHAN LA N | 208 |
| ROCKFORD RD | 138 |
| STATE HWY 169 | 128 |
| 34TH AVE N | 116 |
| STATE HWY 55 | 116 |
| ANNAPOLIS LA N | 102 |
| HARBOR LA N | 100 |
| CO RD 6 | 94 |
| 18TH AVE N | 86 |
| MEDICINE LAKE BLVD E | 76 |
| VICKSBURG LA N | 74 |
| INTERSTATE 494 | 70 |
| CAMPUS DR | 68 |
| CO RD 101 | 68 |
| XENIUM LA N | 66 |
| 36TH AVE N | 62 |
| OLIVE LA N | 56 |
| ZACHARY LA N | 56 |
| SHENANDOAH LA N | 54 |
| 41ST AVE N | 52 |
| 43RD AVE N | 52 |
| PLYMOUTH BLVD | 48 |
| 37TH AVE N | 46 |
| FERNBROOK LA N | 46 |
| MEDICINE LAKE DR W | 46 |
| 14TH AVE N | 44 |
| 45TH AVE N | 44 |
| 54TH AVE N | 42 |
| PEONY LA N | 42 |
| Other | 604 |
2002 - 2018 National Fire Incident Reporting System (NFIRS) incidents
- Incident types reported to NFIRS in Plymouth, MN
- 3,11222.7%Fire
- 2,68819.6%Hazardous Condition
- 2,66519.4%False Alarm
- 2,47918.1%Good Intent Call
- 1,3439.8%Service Call
- 1,3389.8%Rescue & EMS
- 530.4%Overpressure Rupture
- 250.2%Severe Weather
- 140.1%Special Incident
- Fire incident types reported to NFIRS in Plymouth, MN
- 2,17169.8%Structure Fires
- 50616.3%Outside Fires
- 36411.7%Mobile Property/Vehicle Fires
- 712.3%Other
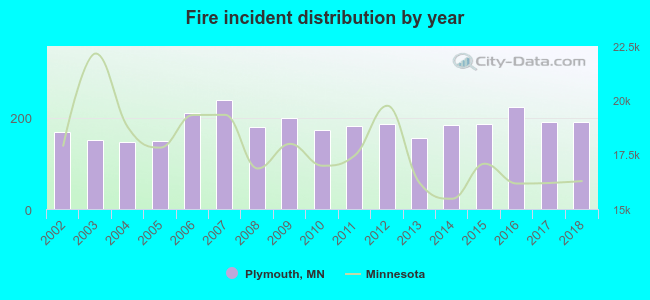 According to the data from the years 2002 - 2018 the average number of fires per year is 183. The highest number of reported fires - 238 took place in 2007, and the least - 147 in 2004. The data has a growing trend.
The average number of yearly fire incidents per 10k residents in Plymouth, MN compared to nearest cities:
(Note: Based on data for the last 3 years, including only cities with population 5,000 and above)
| Plymouth: | 26.9 |
| New Hope: | 25.3 |
| Crystal: | 21.8 |
| Golden Valley: | 25.9 |
| Minnetonka: | 14.6 |
| Medina: | 22.3 |
| Robbinsdale: | 31.4 |
| Maple Grove: | 9.9 |
| Hopkins: | 30.1 |
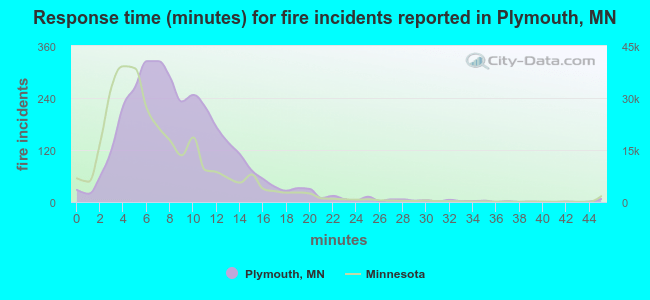 The median response time based on all reported fire incidents is 8 minutes. This is higher than the Minnesota median value.
The median response time in Plymouth, MN compared to nearest cities:
(Note: Based on data for all years, including only cities with at least 500 fire incidents)
| Plymouth: | 8 minutes |
| New Hope: | 5 minutes |
| Crystal: | 5 minutes |
| Golden Valley: | 7 minutes |
| Minnetonka: | 7 minutes |
| Robbinsdale: | 6 minutes |
| Maple Grove: | 7 minutes |
| Hopkins: | 5 minutes |
| St. Louis Park: | 5 minutes |
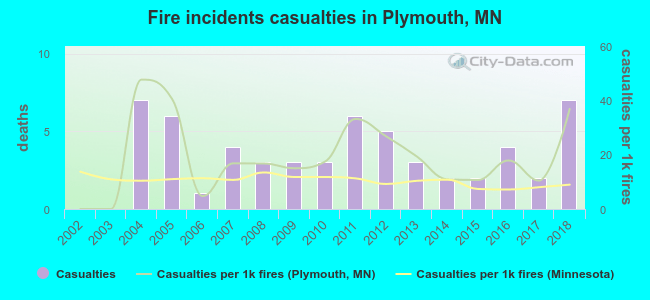 Based on the data from the years 2002 - 2018 the average number of fire-related casualties per year is 3. The highest number of reported injuries - 7 took place in 2004, and the lowest - 0 in 2002. The data has a rising trend.
The average number of injuries per 1,000 fires is 19. This indicator was the highest - 48 in 2004, and the lowest 0 in 2002. The trend for casualties per 1,000 incidents is increasing. Compared to the Minnesota value the number of casualties per 1,000 fire incidents is higher.
Based on the data from the years 2002 - 2018 the average number of fire-related casualties per year is 3. The highest number of reported injuries - 7 took place in 2004, and the lowest - 0 in 2002. The data has a rising trend.
The average number of injuries per 1,000 fires is 19. This indicator was the highest - 48 in 2004, and the lowest 0 in 2002. The trend for casualties per 1,000 incidents is increasing. Compared to the Minnesota value the number of casualties per 1,000 fire incidents is higher.Casualties per 1,000 incidents in Plymouth, MN compared to nearest cities:
(Note: Based on data for all years, including only cities with at least 500 fire incidents)
| Plymouth: | 18.6 |
| New Hope: | 11.0 |
| Crystal: | 13.1 |
| Golden Valley: | 2.1 |
| Minnetonka: | 20.8 |
| Robbinsdale: | 1.7 |
| Maple Grove: | 26.0 |
| Hopkins: | 17.8 |
| St. Louis Park: | 32.2 |
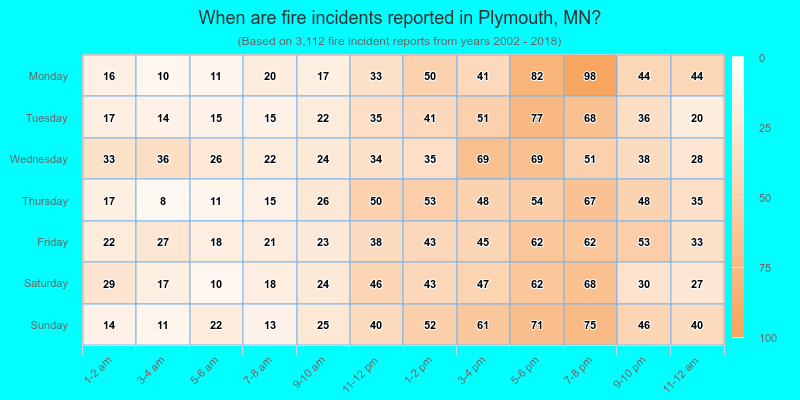
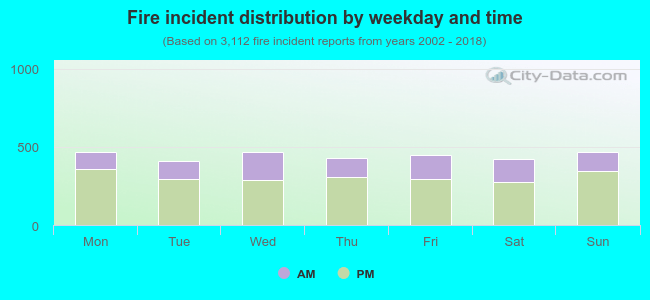 30.4% incidents where reported in the morning and 69.6% in the evening. The most fires (15.1%) took place on Sunday, and the least (13.2%) on Tuesday.
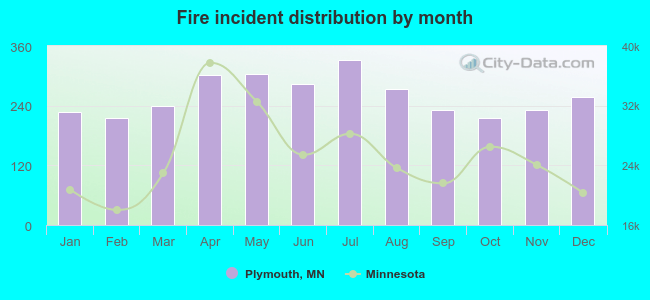 Based on the 3,112 reports from years 2002 - 2018 most fires (10.6%) took place during July, and the least (6.9%) in February.
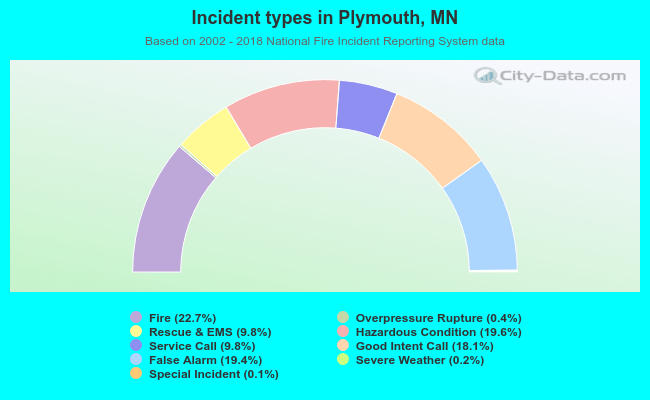 Out of all 13,717 cases reported during the years 2002 - 2018, the most belonged to the categories: Fire (22.7%), Hazardous Condition (19.6%), and False Alarm (19.4%).
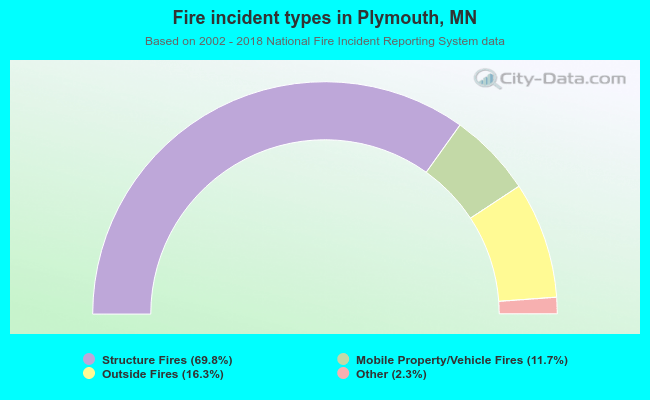 When looking into fire subcategories, the most incidents belonged to: Structure Fires (69.8%), and Outside Fires (16.3%).