Pooler: Fire Incidents, Georgia (GA)
Where are fire incidents reported in Pooler, GA
Something went wrong! Please refresh the page.
| Fire incidents reported | |
|---|---|
| Sreet name | Count |
| INTERSTATE 95 | 262 |
| ROGERS ST | 182 |
| POOLER PKY | 136 |
| INTERSTATE 16 | 126 |
| HWY 80 | 102 |
| 80 HWY | 86 |
| QUACCO RD | 84 |
| HIGHWAY 80 | 72 |
| PINE BARREN RD | 64 |
| MOORE AVE | 60 |
| GRAY ST | 44 |
| GODLEY STATION BLVD | 38 |
| JESUP RD | 38 |
| DEAN FOREST RD | 36 |
| PARK AVE | 32 |
| LONGLEAF CIR | 30 |
| BENTON BLVD | 28 |
| BOURNE AVE | 28 |
| OLD LOUISVILLE RD | 28 |
| TANGER OUTLETS BLVD | 28 |
| GARDEN ACRES WAY | 26 |
| SILVERTON RD | 26 |
| HARMONY BLVD | 24 |
| OSPREY POINT CIR | 24 |
| HIDEAWAY POINT RD | 22 |
| I 16 | 22 |
| MELL ST | 22 |
| MILL CREEK CIR | 22 |
| OLD DEAN FOREST RD | 22 |
| ALTA TOWNE CIR | 20 |
| Other | 44 |
2002 - 2018 National Fire Incident Reporting System (NFIRS) incidents
- Incident types reported to NFIRS in Pooler, GA
- 9,46959.5%Rescue & EMS
- 1,77811.2%Fire
- 1,4379.0%Service Call
- 1,0996.9%Good Intent Call
- 1,0806.8%False Alarm
- 9345.9%Hazardous Condition
- 860.5%Severe Weather
- 300.2%Overpressure Rupture
- Fire incident types reported to NFIRS in Pooler, GA
- 71740.3%Outside Fires
- 58532.9%Structure Fires
- 47226.5%Mobile Property/Vehicle Fires
- 40.2%Other
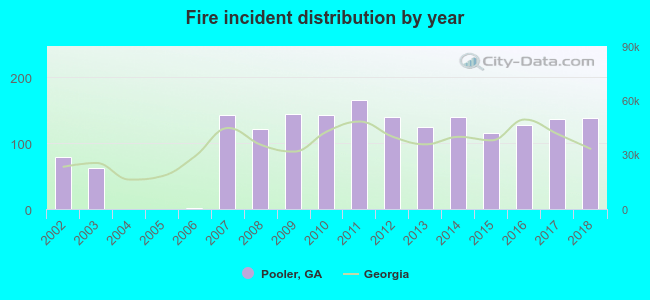 According to the data from the years 2002 - 2018 the average number of fires per year is 105. The highest number of fires - 165 took place in 2011, and the least - 0 in 2004. The data has an increasing trend.
The average number of yearly fire incidents per 10k residents in Pooler, GA compared to nearest cities:
(Note: Based on data for the last 3 years, including only cities with population 5,000 and above)
| Pooler: | 60.2 |
| Garden City: | 134.9 |
| Port Wentworth: | 85.2 |
| Georgetown: | 6.2 |
| Savannah: | 85.0 |
| Richmond Hill: | 89.6 |
| Rincon: | 63.6 |
| Skidaway Island: | 4.8 |
| Wilmington Island: | 0.7 |
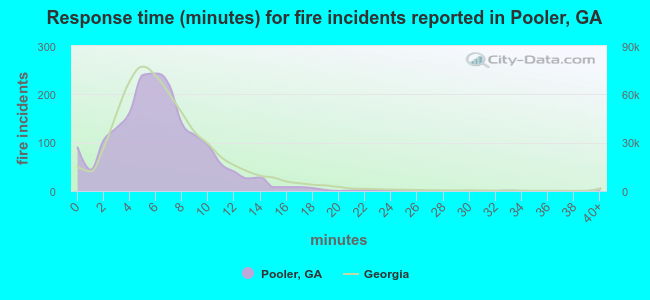 The median response time based on all reported fire incidents is 6 minutes. This is close to the state median value.
The median response time in Pooler, GA compared to nearest cities:
(Note: Based on data for all years, including only cities with at least 500 fire incidents)
| Pooler: | 6 minutes |
| Bloomingdale: | 6 minutes |
| Garden City: | 5 minutes |
| Port Wentworth: | 5 minutes |
| Savannah: | 4 minutes |
| Richmond Hill: | 6 minutes |
| Rincon: | 6 minutes |
| Guyton: | 8 minutes |
| Springfield: | 7 minutes |
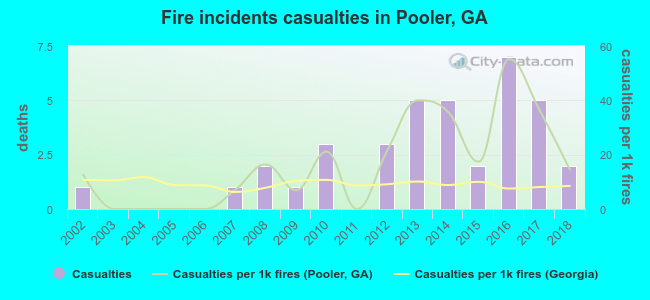 According to the data from the years 2002 - 2018 the average number of fire-related yearly casualties is 2. The highest number of injuries - 7 took place in 2016, and the lowest - 0 in 2003. The data has a growing trend.
The average number of casualties per 1,000 fires is 17. This indicator was the highest - 55 in 2016, and the lowest 0 in 2003. The trend for casualties per 1,000 fires is increasing. Compared to the state value the number of casualties per 1,000 fire incidents is much higher.
According to the data from the years 2002 - 2018 the average number of fire-related yearly casualties is 2. The highest number of injuries - 7 took place in 2016, and the lowest - 0 in 2003. The data has a growing trend.
The average number of casualties per 1,000 fires is 17. This indicator was the highest - 55 in 2016, and the lowest 0 in 2003. The trend for casualties per 1,000 fires is increasing. Compared to the state value the number of casualties per 1,000 fire incidents is much higher.Casualties per 1,000 incidents in Pooler, GA compared to nearest cities:
(Note: Based on data for all years, including only cities with at least 500 fire incidents)
| Pooler: | 20.8 |
| Bloomingdale: | 15.8 |
| Garden City: | 0.8 |
| Port Wentworth: | 1.7 |
| Savannah: | 7.0 |
| Richmond Hill: | 4.5 |
| Rincon: | 5.9 |
| Guyton: | 4.5 |
| Springfield: | 3.5 |
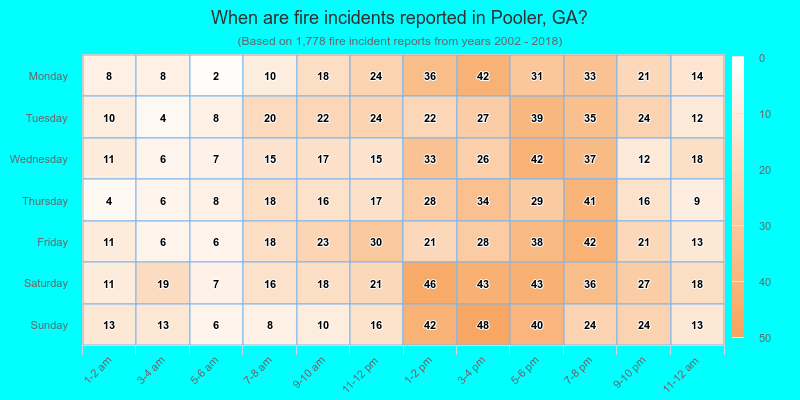
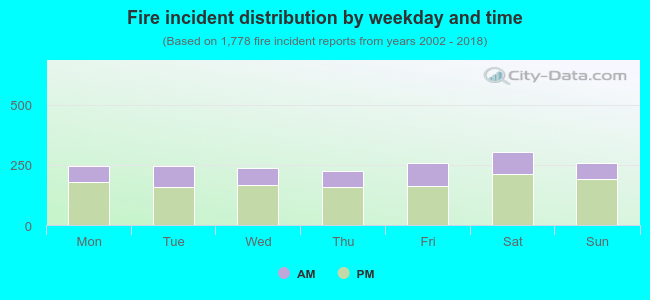 30.9% incidents where reported in the morning and 69.1% in the evening. The most fires (17.2%) took place on Saturday, and the least (12.7%) on Thursday.
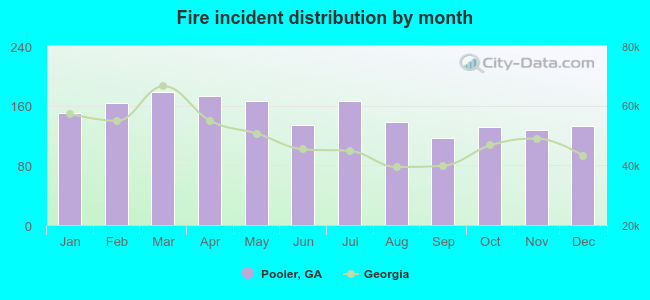 According to the 1,778 incident reports from years 2002 - 2018 most fires (10.0%) took place during March, and the least (6.6%) in September.
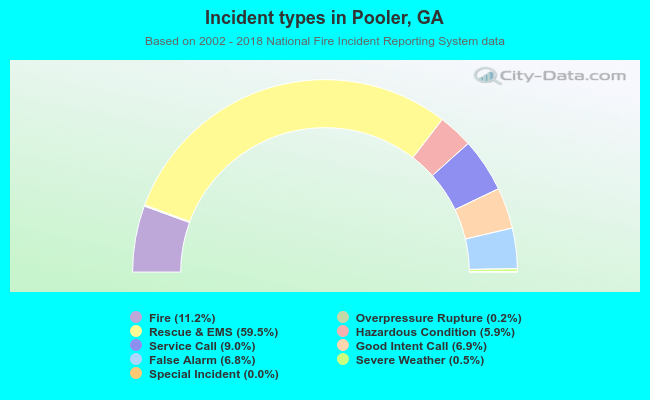 Out of all 15,914 cases reported during the years 2002 - 2018, the most belonged to the categories: Rescue & EMS (59.5%), Fire (11.2%), and Service Call (9.0%).
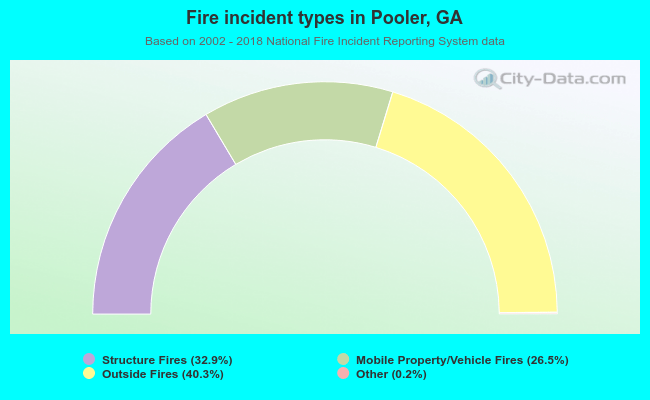 When looking into fire subcategories, the most incidents belonged to: Outside Fires (40.3%), and Structure Fires (32.9%).