Port Wentworth: Fire Incidents, Georgia (GA)
Where are fire incidents reported in Port Wentworth, GA
Something went wrong! Please refresh the page.
|
| |||||||||||||||||||||||||||||||||||||||||||||||||||||||||||||||||||||||||||||||||||||||||||||||||||||||||||||
2006 - 2018 National Fire Incident Reporting System (NFIRS) incidents
- Incident types reported to NFIRS in Port Wentworth, GA
- 3,41765.0%Rescue & EMS
- 60211.4%Fire
- 4789.1%False Alarm
- 3206.1%Hazardous Condition
- 2404.6%Service Call
- 1863.5%Good Intent Call
- 60.1%Overpressure Rupture
- Fire incident types reported to NFIRS in Port Wentworth, GA
- 22437.2%Outside Fires
- 19231.9%Mobile Property/Vehicle Fires
- 18430.6%Structure Fires
- 20.3%Other
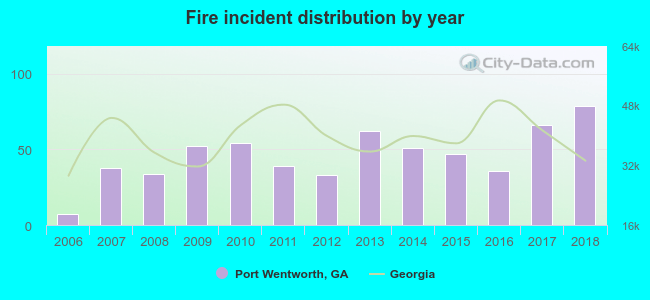 Based on the data from the years 2006 - 2018 the average number of fires per year is 46. The highest number of fires - 79 took place in 2018, and the least - 7 in 2006. The data has an increasing trend.
The average number of yearly fire incidents per 10k residents in Port Wentworth, GA compared to nearest cities:
(Note: Based on data for the last 3 years, including only cities with population 5,000 and above)
| Port Wentworth: | 85.2 |
| Garden City: | 134.9 |
| Pooler: | 60.2 |
| Savannah: | 85.0 |
| Rincon: | 63.6 |
| Georgetown: | 6.2 |
| Wilmington Island: | 0.7 |
| Richmond Hill: | 89.6 |
| Skidaway Island: | 4.8 |
 The median response time based on all reported fire incidents is 5 minutes. This is lower compared to the Georgia median value.
The median response time in Port Wentworth, GA compared to nearest cities:
(Note: Based on data for all years, including only cities with at least 500 fire incidents)
| Port Wentworth: | 5 minutes |
| Garden City: | 5 minutes |
| Pooler: | 6 minutes |
| Bloomingdale: | 6 minutes |
| Savannah: | 4 minutes |
| Rincon: | 6 minutes |
| Springfield: | 7 minutes |
| Guyton: | 8 minutes |
| Richmond Hill: | 6 minutes |
 28.6% incidents where reported in the morning and 71.4% in the evening. The most fires (15.6%) took place on Wednesday, and the least (13.0%) on Monday.
 Based on the 602 fire incident reports from years 2006 - 2018 most fires (10.3%) took place during January, and the least (6.5%) in June.
 Out of all 5,258 cases reported during the years 2006 - 2018, the most belonged to the categories: Rescue & EMS (65.0%), Fire (11.4%), and False Alarm (9.1%).
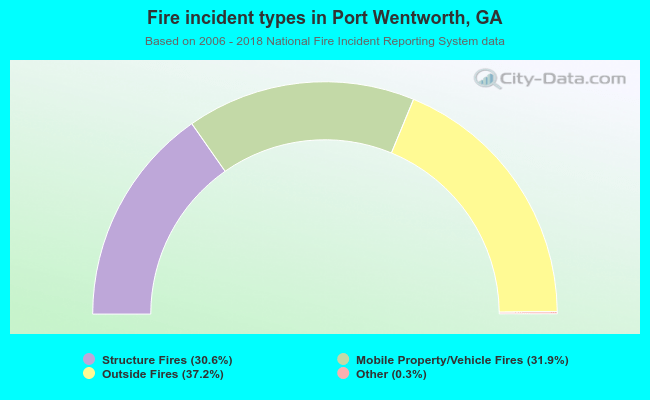 When looking into fire subcategories, the most incidents belonged to: Outside Fires (37.2%), and Mobile Property/Vehicle Fires (31.9%).