Prosser: Fire Incidents, Washington (WA)
Where are fire incidents reported in Prosser, WA
Something went wrong! Please refresh the page.
|
| |||||||||||||||||||||||||||||||||||||||||||||||||||||||||||||||||||||||||||||||||||||||||||||||||||||||||||||
| Other | 66 | |||||||||||||||||||||||||||||||||||||||||||||||||||||||||||||||||||||||||||||||||||||||||||||||||||||||||||||
2002 - 2018 National Fire Incident Reporting System (NFIRS) incidents
- Incident types reported to NFIRS in Prosser, WA
- 1,08434.0%Fire
- 91228.6%Rescue & EMS
- 48515.2%Good Intent Call
- 32310.1%Service Call
- 1946.1%Hazardous Condition
- 1815.7%False Alarm
- 70.2%Special Incident
- Fire incident types reported to NFIRS in Prosser, WA
- 61857.0%Outside Fires
- 27525.4%Structure Fires
- 12711.7%Mobile Property/Vehicle Fires
- 645.9%Other
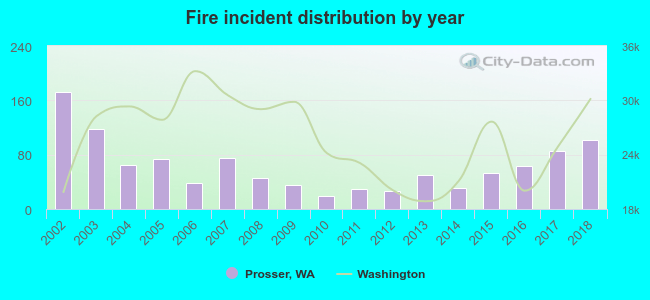 Based on the data from the years 2002 - 2018 the average number of fires per year is 64. The highest number of fire incidents - 173 took place in 2002, and the least - 19 in 2010. The data has a dropping trend.
The average number of yearly fire incidents per 10k residents in Prosser, WA compared to nearest cities:
(Note: Based on data for the last 3 years, including only cities with population 5,000 and above)
| Prosser: | 144.2 |
| Grandview: | 44.6 |
| Sunnyside: | 59.9 |
| West Richland: | 39.9 |
| Richland: | 34.6 |
| Toppenish: | 151.9 |
| Kennewick: | 54.0 |
| Pasco: | 47.5 |
| Finley: | 8.3 |
 The median response time based on all reported fire incidents is 8 minutes. This is similar to the Washington median value.
The median response time in Prosser, WA compared to nearest cities:
(Note: Based on data for all years, including only cities with at least 500 fire incidents)
| Prosser: | 8 minutes |
| Grandview: | 11 minutes |
| Mabton: | 14 minutes |
| Benton City: | 9 minutes |
| Sunnyside: | 8 minutes |
| West Richland: | 8 minutes |
| Granger: | 11 minutes |
| Richland: | 6 minutes |
| Boardman: | 9 minutes |
 29.9% incidents where reported in the morning and 70.1% in the evening. The most fires (15.3%) took place on Tuesday, and the least (12.0%) on Wednesday.
 According to the 1,084 fire incidents from years 2002 - 2018 most fires (15.8%) took place during July, and the least (4.2%) in January.
 Out of all 3,190 cases reported during the years 2002 - 2018, the most belonged to the categories: Fire (34.0%), Rescue & EMS (28.6%), and Good Intent Call (15.2%).
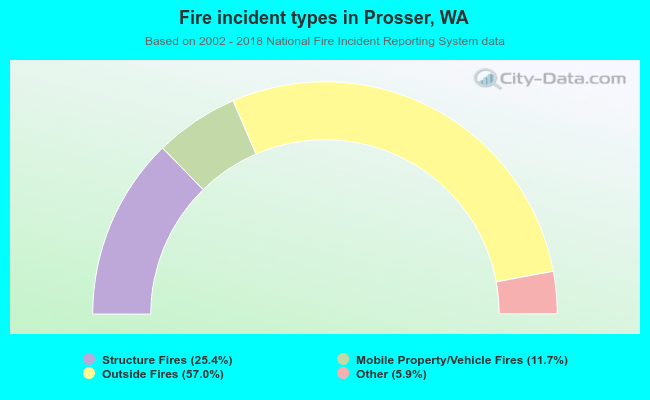 When looking into fire subcategories, the most incidents belonged to: Outside Fires (57.0%), and Structure Fires (25.4%).