Sale Creek: Fire Incidents, Tennessee (TN)
Where are fire incidents reported in Sale Creek, TN
Something went wrong! Please refresh the page.
|
| |||||||||||||||||||||||||||||||||||||||||||||||||||||||||||||||||||||||||||||||||||||||||||||||||||||||||||||
2004 - 2018 National Fire Incident Reporting System (NFIRS) incidents
- Incident types reported to NFIRS in Sale Creek, TN
- 30646.2%Fire
- 12018.1%Hazardous Condition
- 10115.2%Rescue & EMS
- 7911.9%Good Intent Call
- 345.1%Service Call
- 182.7%False Alarm
- 30.5%Severe Weather
- 10.2%Overpressure Rupture
- 10.2%Special Incident
- Fire incident types reported to NFIRS in Sale Creek, TN
- 16052.3%Outside Fires
- 9330.4%Structure Fires
- 4013.1%Mobile Property/Vehicle Fires
- 134.2%Other
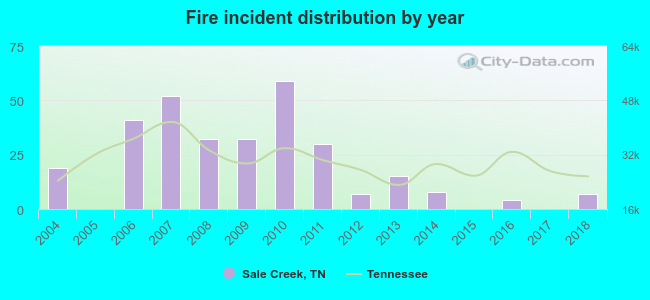 According to the data from the years 2004 - 2018 the average number of fire incidents per year is 20. The highest number of reported fire incidents - 59 took place in 2010, and the least - 0 in 2005. The data has a dropping trend.
The average number of yearly fire incidents per 10k residents in Sale Creek, TN compared to nearest cities:
(Note: Based on data for the last 3 years, including only cities with population 5,000 and above)
| Sale Creek: | 8.3 |
| Dayton: | 153.7 |
| Harrison: | 9.9 |
| Dunlap: | 113.1 |
| Cleveland: | 116.6 |
| Red Bank: | 2.5 |
| Signal Mountain: | 64.2 |
| Collegedale: | 15.5 |
| Chattanooga: | 46.2 |
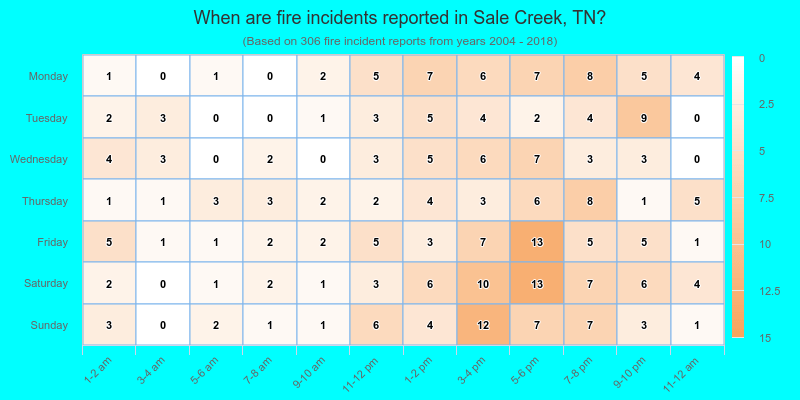
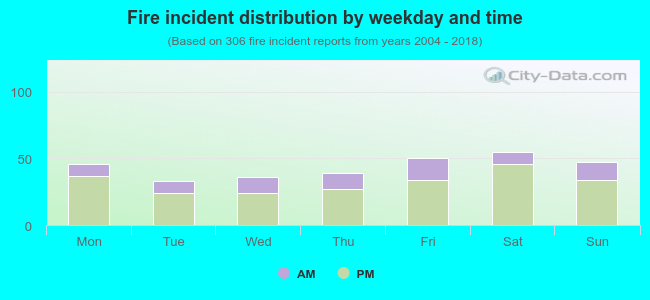 26.1% incidents where reported in the morning and 73.9% in the evening. The most fires (18.0%) took place on Saturday, and the least (10.8%) on Tuesday.
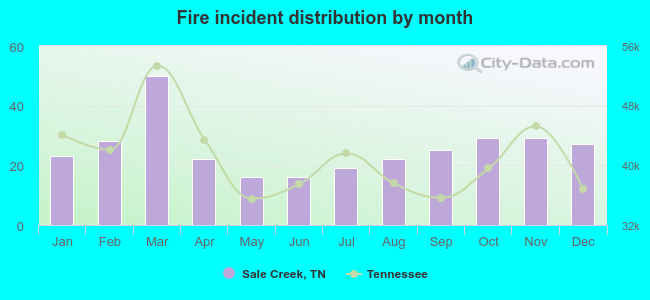 Based on the 306 reports from years 2004 - 2018 most fires (16.3%) took place during March, and the least (5.2%) in May.
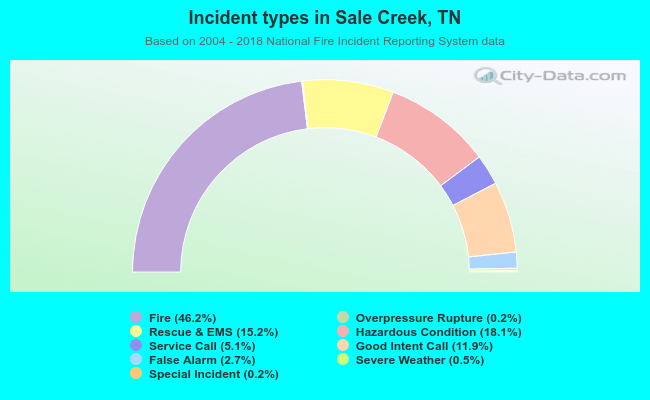 Out of all 663 cases reported during the years 2004 - 2018, the most belonged to the categories: Fire (46.2%), Hazardous Condition (18.1%), and Rescue & EMS (15.2%).
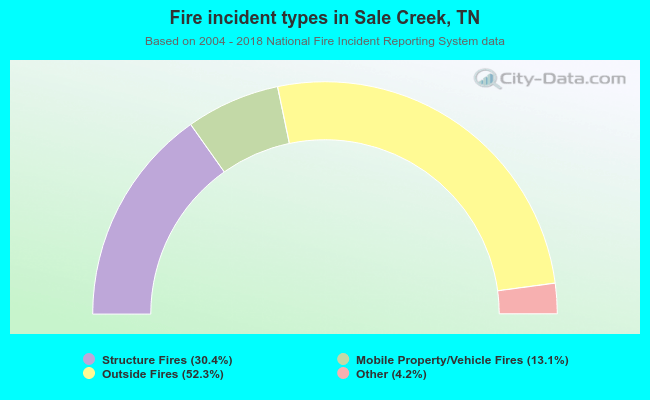 When looking into fire subcategories, the most reports belonged to: Outside Fires (52.3%), and Structure Fires (30.4%).