San Rafael: Fire Incidents, California (CA)
Where are fire incidents reported in San Rafael, CA
Something went wrong! Please refresh the page.
| Fire incidents reported | |
|---|---|
| Sreet name | Count |
| CANAL ST | 116 |
| FRANCISCO BLVD | 108 |
| FOURTH ST | 98 |
| CIVIC CENTER DR | 88 |
| FRANCISCO BL | 72 |
| 3RD ST | 68 |
| ANDERSEN DR | 66 |
| THIRD ST | 60 |
| IRWIN ST | 56 |
| LINCOLN AVE | 56 |
| SAN PEDRO RD | 54 |
| 4TH ST | 52 |
| B ST | 50 |
| MERRYDALE RD | 48 |
| MISSION AVE | 48 |
| BELLAM BLVD | 46 |
| KERNER BL | 40 |
| LINCOLN AV | 40 |
| KERNER BLVD | 36 |
| SMITH RANCH RD | 36 |
| NORTHGATE MALL | 34 |
| C ST | 32 |
| D ST | 30 |
| DU BOIS ST | 30 |
| LARKSPUR ST | 28 |
| LOS RANCHITOS RD | 28 |
| YOSEMITE RD | 28 |
| LAS GALLINAS AV | 26 |
| LAS GALLINAS AVE | 22 |
| GARY PL | 20 |
| Other | 710 |
2005 - 2018 National Fire Incident Reporting System (NFIRS) incidents
- Incident types reported to NFIRS in San Rafael, CA
- 22,00062.0%Rescue & EMS
- 4,47312.6%Good Intent Call
- 3,5199.9%Service Call
- 2,2266.3%Fire
- 1,8935.3%False Alarm
- 1,2673.6%Hazardous Condition
- 420.1%Special Incident
- 410.1%Severe Weather
- Fire incident types reported to NFIRS in San Rafael, CA
- 92241.4%Outside Fires
- 81636.7%Structure Fires
- 28712.9%Mobile Property/Vehicle Fires
- 2019.0%Other
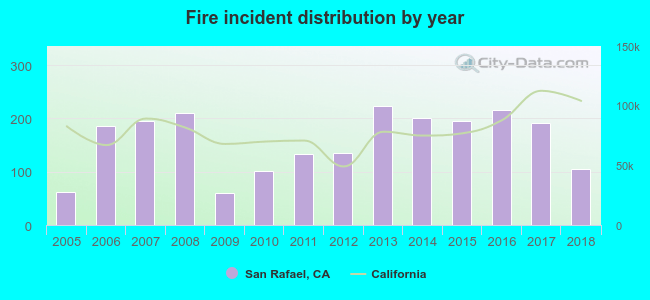 Based on the data from the years 2005 - 2018 the average number of fire incidents per year is 159. The highest number of fire incidents - 224 took place in 2013, and the least - 60 in 2009. The data has a growing trend.
The average number of yearly fire incidents per 10k residents in San Rafael, CA compared to nearest cities:
(Note: Based on data for the last 3 years, including only cities with population 5,000 and above)
| San Rafael: | 28.9 |
| San Anselmo: | 18.7 |
| Kentfield: | 29.3 |
| Larkspur: | 14.9 |
| Fairfax: | 24.4 |
| Corte Madera: | 29.2 |
| Mill Valley: | 43.0 |
| Strawberry: | 6.2 |
| Tiburon: | 19.9 |
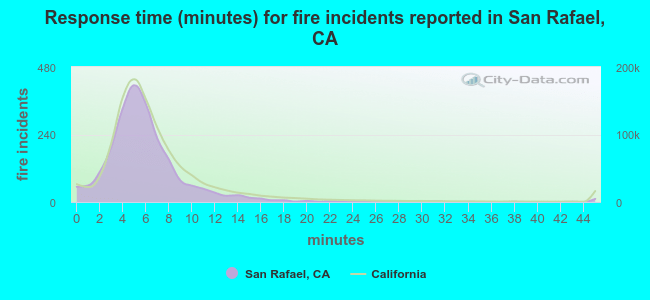 The median response time based on all reported fire incidents is 5 minutes. This is lower than the state median value.
The median response time in San Rafael, CA compared to nearest cities:
(Note: Based on data for all years, including only cities with at least 500 fire incidents)
| San Rafael: | 5 minutes |
| Mill Valley: | 6 minutes |
| Novato: | 6 minutes |
| Sausalito: | 6 minutes |
| San Pablo: | 7 minutes |
| Richmond: | 7 minutes |
| El Cerrito: | 6 minutes |
| Albany: | 4 minutes |
| Hercules: | 6 minutes |
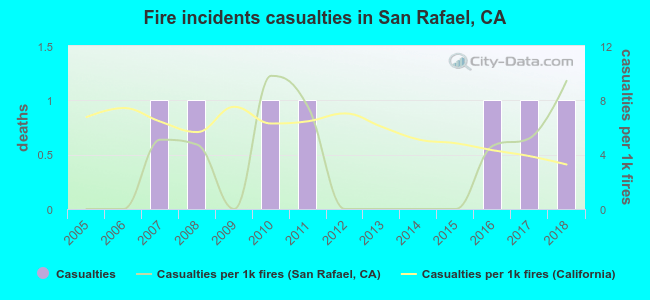 According to the data from the years 2005 - 2018 the average number of fire-related casualties per year is 1. The highest number of injuries - 1 took place in 2007, and the lowest - 0 in 2005. The data has a rising trend.
The average number of casualties per 1,000 fires is 3. This indicator was the highest - 10 in 2010, and the lowest 0 in 2005. The trend for casualties per 1,000 fires is rising. Compared to the state value the number of injuries per 1,000 incidents is lower.
According to the data from the years 2005 - 2018 the average number of fire-related casualties per year is 1. The highest number of injuries - 1 took place in 2007, and the lowest - 0 in 2005. The data has a rising trend.
The average number of casualties per 1,000 fires is 3. This indicator was the highest - 10 in 2010, and the lowest 0 in 2005. The trend for casualties per 1,000 fires is rising. Compared to the state value the number of injuries per 1,000 incidents is lower.Casualties per 1,000 incidents in San Rafael, CA compared to nearest cities:
(Note: Based on data for all years, including only cities with at least 500 fire incidents)
| San Rafael: | 3.1 |
| Mill Valley: | 2.6 |
| Novato: | 17.7 |
| Sausalito: | 5.5 |
| San Pablo: | 1.9 |
| Richmond: | 4.0 |
| El Cerrito: | 1.3 |
| Albany: | 1.6 |
| Hercules: | 4.9 |
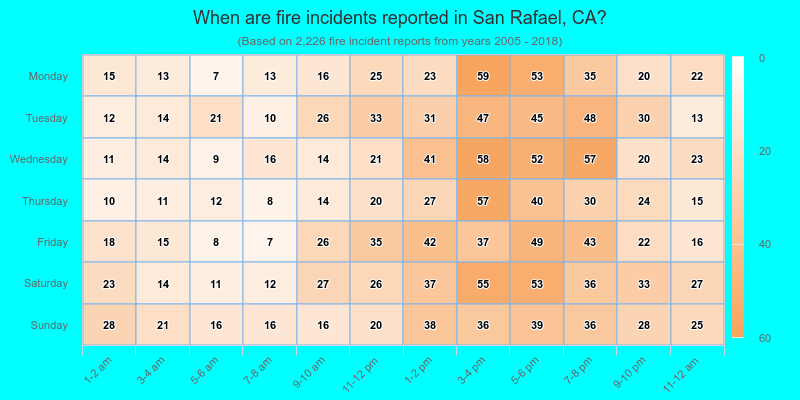
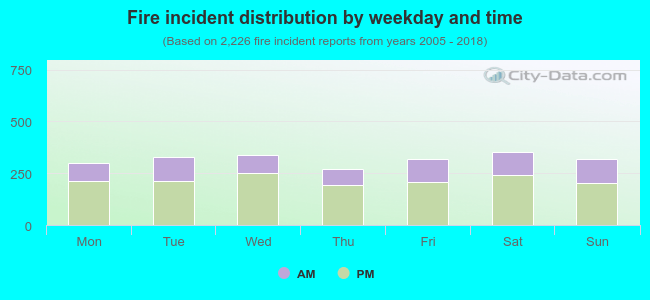 31.6% incidents where reported in the morning and 68.4% in the evening. The most fires (15.9%) took place on Saturday, and the least (12.0%) on Thursday.
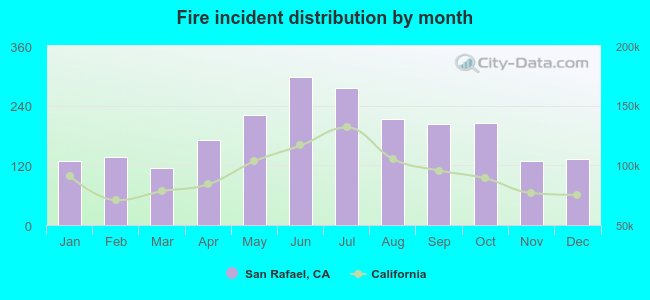 Based on the 2,226 fire incident reports from years 2005 - 2018 most fires (13.3%) took place during June, and the least (5.1%) in March.
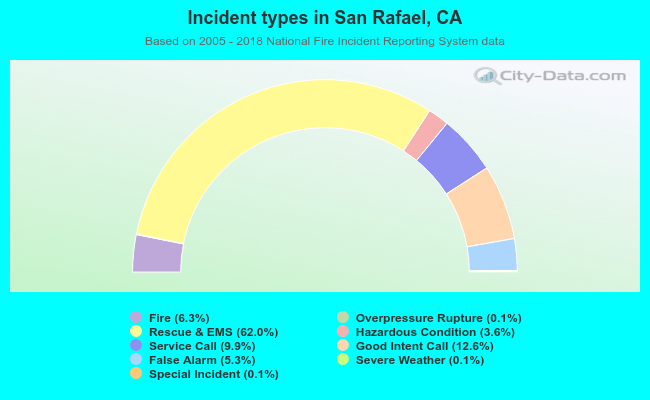 Out of all 35,482 cases reported during the years 2005 - 2018, the most belonged to the categories: Rescue & EMS (62.0%), Good Intent Call (12.6%), and Service Call (9.9%).
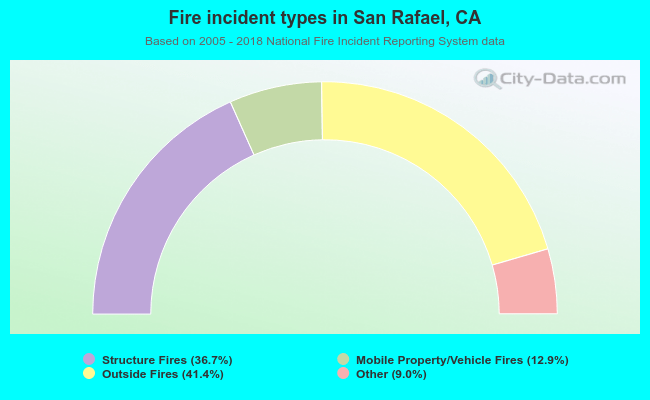 When looking into fire subcategories, the most incidents belonged to: Outside Fires (41.4%), and Structure Fires (36.7%).