Schertz: Fire Incidents, Texas (TX)
Where are fire incidents reported in Schertz, TX
Something went wrong! Please refresh the page.
| Fire incidents reported | |
|---|---|
| Sreet name | Count |
| IH 35 NORTH | 268 |
| IH 35 | 258 |
| FM 1518 | 192 |
| FM 3009 | 128 |
| FM 78 | 98 |
| IH 10 | 72 |
| SCHERTZ PARKWAY | 50 |
| IH 10 EAST | 44 |
| SCHERTZ PKY | 36 |
| ELBEL RD | 32 |
| BLK IH 35 | 28 |
| ELBEL | 24 |
| CURTISS AVE | 22 |
| OAK | 22 |
| FM 2252 | 20 |
| FM 482 | 20 |
| AVIATION | 18 |
| FM 1518 RD | 18 |
| IH 35 N | 18 |
| IH 35 NORTH1 HWY | 18 |
| TRAINER HALE RD | 18 |
| WARE SEGUIN | 18 |
| FM 1103 | 16 |
| MAIN | 16 |
| MASKE | 16 |
| SCHAEFER | 16 |
| COLUMBIA | 14 |
| DOERR LN | 14 |
| GREEN VALLEY | 14 |
| LOWER SEGUIN RD | 14 |
| Other | 199 |
2002 - 2018 National Fire Incident Reporting System (NFIRS) incidents
- Incident types reported to NFIRS in Schertz, TX
- 6,54045.9%Rescue & EMS
- 2,18315.3%Good Intent Call
- 1,74112.2%Fire
- 1,2819.0%Hazardous Condition
- 1,1508.1%Service Call
- 7685.4%False Alarm
- 4112.9%Special Incident
- 1731.2%Overpressure Rupture
- Fire incident types reported to NFIRS in Schertz, TX
- 71841.2%Outside Fires
- 66538.2%Structure Fires
- 30517.5%Mobile Property/Vehicle Fires
- 533.0%Other
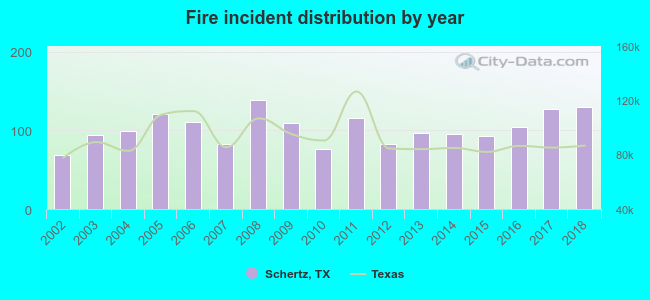 According to the data from the years 2002 - 2018 the average number of fire incidents per year is 102. The highest number of reported fire incidents - 138 took place in 2008, and the least - 68 in 2002. The data has a rising trend.
The average number of yearly fire incidents per 10k residents in Schertz, TX compared to nearest cities:
(Note: Based on data for the last 3 years, including only cities with population 5,000 and above)
| Schertz: | 32.5 |
| Cibolo: | 29.5 |
| Universal City: | 28.7 |
| Selma: | 31.4 |
| Converse: | 21.2 |
| Live Oak: | 4.0 |
| Windcrest: | 17.5 |
| Kirby: | 30.8 |
| Terrell Hills: | 7.7 |
 The median response time based on all reported fire incidents is 7 minutes. This is about the same as the Texas median value.
The median response time in Schertz, TX compared to nearest cities:
(Note: Based on data for all years, including only cities with at least 500 fire incidents)
| Schertz: | 7 minutes |
| Cibolo: | 8 minutes |
| Universal City: | 5 minutes |
| Converse: | 6 minutes |
| New Braunfels: | 7 minutes |
| Bulverde: | 9 minutes |
| San Antonio: | 5 minutes |
| Seguin: | 8 minutes |
| Canyon Lake: | 9 minutes |
 According to the reports from the years 2002 - 2018 the average number of fire-related casualties per year is 1. The highest number of reported casualties - 2 took place in 2007, and the lowest - 0 in 2003. The data has a declining trend.
The average number of casualties per 1,000 fires is 9. This indicator was the highest - 24 in 2012, and the lowest 0 in 2003. The trend for casualties per 1,000 fires is decreasing. Compared to the state value the number of casualties per 1,000 fires is similar.
According to the reports from the years 2002 - 2018 the average number of fire-related casualties per year is 1. The highest number of reported casualties - 2 took place in 2007, and the lowest - 0 in 2003. The data has a declining trend.
The average number of casualties per 1,000 fires is 9. This indicator was the highest - 24 in 2012, and the lowest 0 in 2003. The trend for casualties per 1,000 fires is decreasing. Compared to the state value the number of casualties per 1,000 fires is similar.Casualties per 1,000 incidents in Schertz, TX compared to nearest cities:
(Note: Based on data for all years, including only cities with at least 500 fire incidents)
| Schertz: | 7.5 |
| Cibolo: | 5.2 |
| Universal City: | 23.8 |
| Converse: | 5.6 |
| New Braunfels: | 11.2 |
| Bulverde: | 0.0 |
| San Antonio: | 4.0 |
| Seguin: | 11.7 |
| Canyon Lake: | 2.2 |
 29.6% incidents where reported in the morning and 70.4% in the evening. The most fires (16.5%) took place on Monday, and the least (12.8%) on Tuesday.
 According to the 1,741 fire incident reports from years 2002 - 2018 most fires (10.9%) took place during January, and the least (6.8%) in November.
 Out of all 14,260 cases reported during the years 2002 - 2018, the most belonged to the categories: Rescue & EMS (45.9%), Good Intent Call (15.3%), and Fire (12.2%).
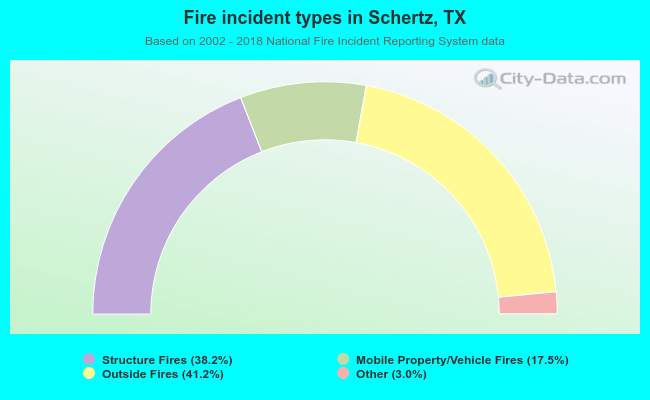 When looking into fire subcategories, the most reports belonged to: Outside Fires (41.2%), and Structure Fires (38.2%).