Windcrest: Fire Incidents, Texas (TX)
Where are fire incidents reported in Windcrest, TX
Something went wrong! Please refresh the page.
|
| |||||||||||||||||||||||||||||||||||||||||||||||||||||||||||||||||||||||||||||||||||||||||||||||||||||||||||||
2002 - 2018 National Fire Incident Reporting System (NFIRS) incidents
- Incident types reported to NFIRS in Windcrest, TX
- 1,12349.0%Rescue & EMS
- 34815.2%Good Intent Call
- 30413.3%Fire
- 2018.8%Hazardous Condition
- 1978.6%False Alarm
- 1155.0%Service Call
- Fire incident types reported to NFIRS in Windcrest, TX
- 18661.2%Structure Fires
- 4815.8%Outside Fires
- 4213.8%Other
- 289.2%Mobile Property/Vehicle Fires
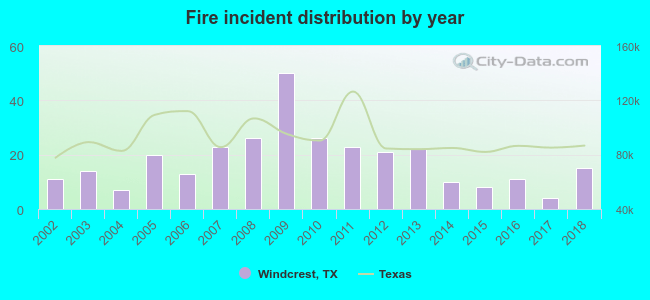 According to the data from the years 2002 - 2018 the average number of fire incidents per year is 18. The highest number of reported fire incidents - 50 took place in 2009, and the least - 4 in 2017. The data has a rising trend.
The average number of yearly fire incidents per 10k residents in Windcrest, TX compared to nearest cities:
(Note: Based on data for the last 3 years, including only cities with population 5,000 and above)
| Windcrest: | 17.5 |
| Live Oak: | 4.0 |
| Kirby: | 30.8 |
| Converse: | 21.2 |
| Terrell Hills: | 7.7 |
| Universal City: | 28.7 |
| Alamo Heights: | 27.3 |
| Selma: | 31.4 |
| Schertz: | 32.5 |

 31.6% incidents where reported in the morning and 68.4% in the evening. The most fires (20.1%) took place on Monday, and the least (9.9%) on Saturday.
 Based on the 304 fire incident reports from years 2002 - 2018 most fires (11.8%) took place during June, and the least (4.6%) in October.
 Out of all 2,292 cases reported during the years 2002 - 2018, the most belonged to the categories: Rescue & EMS (49.0%), Good Intent Call (15.2%), and Fire (13.3%).
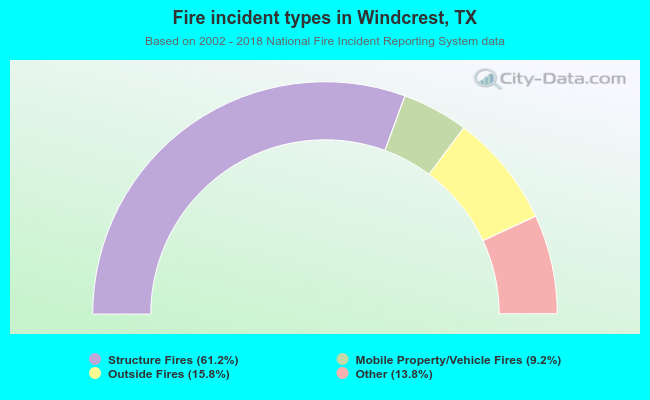 When looking into fire subcategories, the most incidents belonged to: Structure Fires (61.2%), and Outside Fires (15.8%).