Southlake: Fire Incidents, Texas (TX)
Where are fire incidents reported in Southlake, TX
Something went wrong! Please refresh the page.
| Fire incidents reported | |
|---|---|
| Sreet name | Count |
| HWY114 | 128 |
| MUTUAL AID-SOUTHLAKE | 120 |
| FM 1709 | 112 |
| 1709 | 86 |
| KIMBALL AVE | 80 |
| WHITE CHAPEL BLVD | 66 |
| MUTUAL AIDSOUTHLAKE | 60 |
| CARROLL AVE | 54 |
| SOUTHLAKE BLVD | 46 |
| SHADY OAKS DR | 44 |
| 114 | 38 |
| DOVE RD | 34 |
| HIGHLAND ST | 32 |
| ZSOUTHLAKE | 30 |
| RANDOL MILL AVE | 28 |
| CONTINENTAL BLVD | 24 |
| STATE ST | 18 |
| WOODSEY CT | 18 |
| DAVIS BLVD | 16 |
| GRAND AVE | 16 |
| PEYTONVILLE AVE | 16 |
| VILLAGE CENTER DR | 16 |
| BRUMLOW AVE | 14 |
| MAIN ST | 14 |
| BYRON NELSON PKWY | 12 |
| BYRON NELSON PKWY | 12 |
| FLORENCE RD | 12 |
| PEARSON LN | 12 |
| SHADY LN | 12 |
| TURNBERRY LN | 12 |
| Other | 93 |
2002 - 2018 National Fire Incident Reporting System (NFIRS) incidents
- Incident types reported to NFIRS in Southlake, TX
- 7,80247.5%Rescue & EMS
- 3,02818.4%False Alarm
- 1,70510.4%Service Call
- 1,4268.7%Hazardous Condition
- 1,2757.8%Fire
- 1,1166.8%Good Intent Call
- 320.2%Severe Weather
- 300.2%Overpressure Rupture
- Fire incident types reported to NFIRS in Southlake, TX
- 55243.3%Outside Fires
- 50939.9%Structure Fires
- 15712.3%Mobile Property/Vehicle Fires
- 574.5%Other
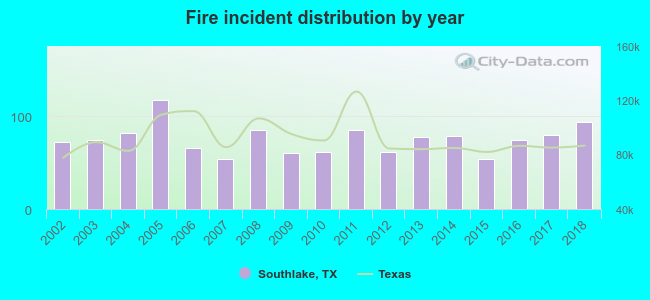 Based on the data from the years 2002 - 2018 the average number of fire incidents per year is 75. The highest number of reported fires - 117 took place in 2005, and the least - 54 in 2007. The data has a growing trend.
The average number of yearly fire incidents per 10k residents in Southlake, TX compared to nearest cities:
(Note: Based on data for the last 3 years, including only cities with population 5,000 and above)
| Southlake: | 28.4 |
| Grapevine: | 35.5 |
| Colleyville: | 22.2 |
| Trophy Club: | 24.9 |
| Keller: | 24.5 |
| Roanoke: | 57.8 |
| Bedford: | 29.2 |
| Flower Mound: | 16.0 |
| Euless: | 29.7 |
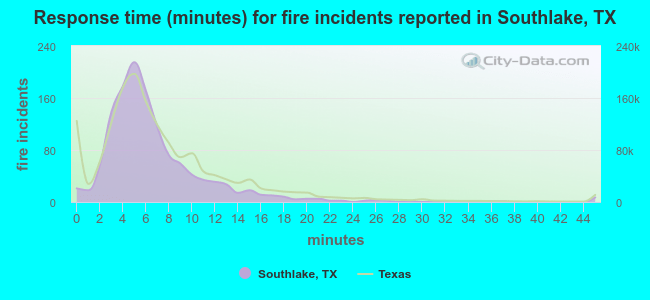 The median response time based on all reported fire incidents is 6 minutes. This is comparable to the Texas median value.
The median response time in Southlake, TX compared to nearest cities:
(Note: Based on data for all years, including only cities with at least 500 fire incidents)
| Southlake: | 6 minutes |
| Grapevine: | 5 minutes |
| Colleyville: | 7 minutes |
| Keller: | 6 minutes |
| Roanoke: | 5 minutes |
| Bedford: | 4 minutes |
| Flower Mound: | 6 minutes |
| Euless: | 5 minutes |
| North Richland Hills: | 6 minutes |
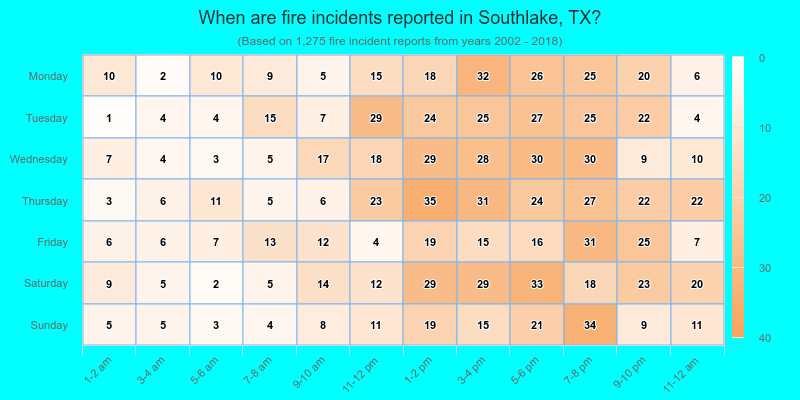
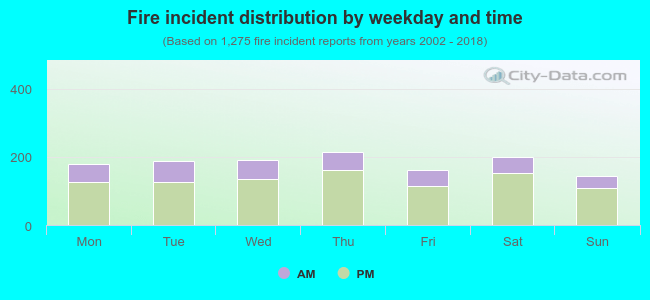 27.5% incidents where reported in the morning and 72.5% in the evening. The most fires (16.9%) took place on Thursday, and the least (11.4%) on Sunday.
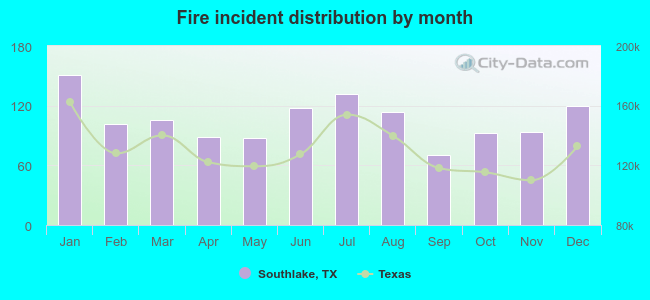 According to the 1,275 incident reports from years 2002 - 2018 most fires (11.8%) took place during January, and the least (5.5%) in September.
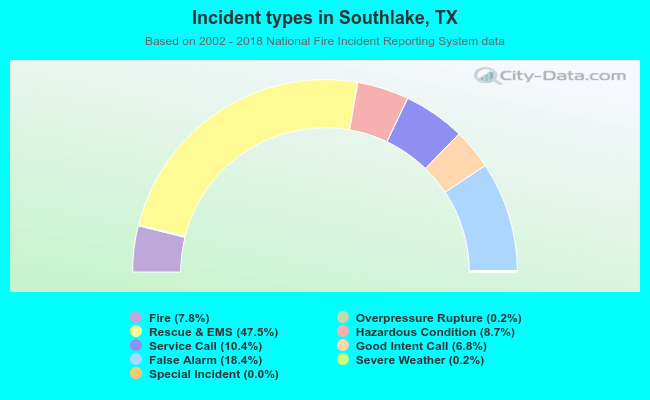 Out of all 16,416 cases reported during the years 2002 - 2018, the most belonged to the categories: Rescue & EMS (47.5%), False Alarm (18.4%), and Service Call (10.4%).
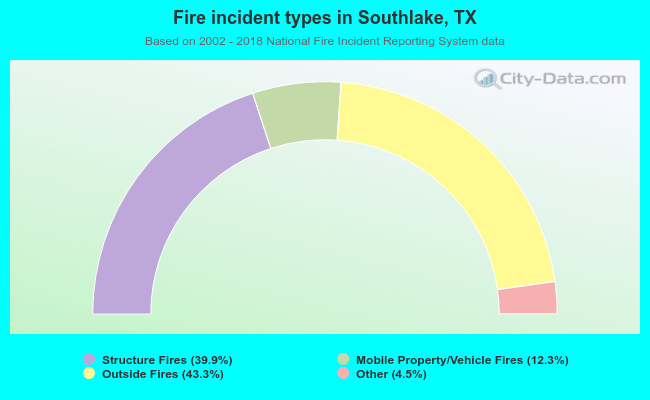 When looking into fire subcategories, the most reports belonged to: Outside Fires (43.3%), and Structure Fires (39.9%).