Trophy Club: Fire Incidents, Texas (TX)
Where are fire incidents reported in Trophy Club, TX
Something went wrong! Please refresh the page.
|
| |||||||||||||||||||||||||||||||||||||||||||||||||||||||||||||||||||||||||||||||||||||||||||||||||||||||||||||
2002 - 2018 National Fire Incident Reporting System (NFIRS) incidents
- Incident types reported to NFIRS in Trophy Club, TX
- 1,82343.7%Rescue & EMS
- 89921.6%Service Call
- 47511.4%False Alarm
- 3999.6%Fire
- 3067.3%Hazardous Condition
- 2486.0%Good Intent Call
- 80.2%Overpressure Rupture
- 70.2%Severe Weather
- Fire incident types reported to NFIRS in Trophy Club, TX
- 22055.1%Structure Fires
- 11929.8%Outside Fires
- 399.8%Other
- 215.3%Mobile Property/Vehicle Fires
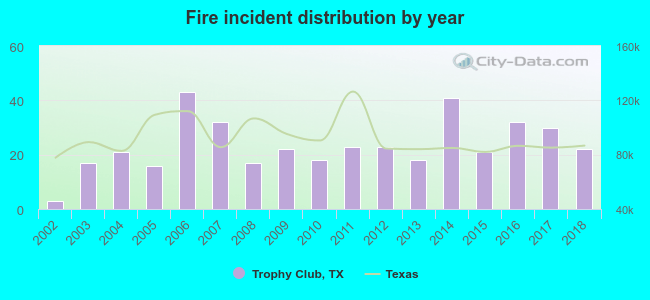 Based on the data from the years 2002 - 2018 the average number of fires per year is 23. The highest number of reported fires - 43 took place in 2006, and the least - 3 in 2002. The data has a rising trend.
The average number of yearly fire incidents per 10k residents in Trophy Club, TX compared to nearest cities:
(Note: Based on data for the last 3 years, including only cities with population 5,000 and above)
| Trophy Club: | 24.9 |
| Roanoke: | 57.8 |
| Southlake: | 28.4 |
| Keller: | 24.5 |
| Flower Mound: | 16.0 |
| Grapevine: | 35.5 |
| Colleyville: | 22.2 |
| Watauga: | 29.2 |
| Highland Village: | 24.0 |
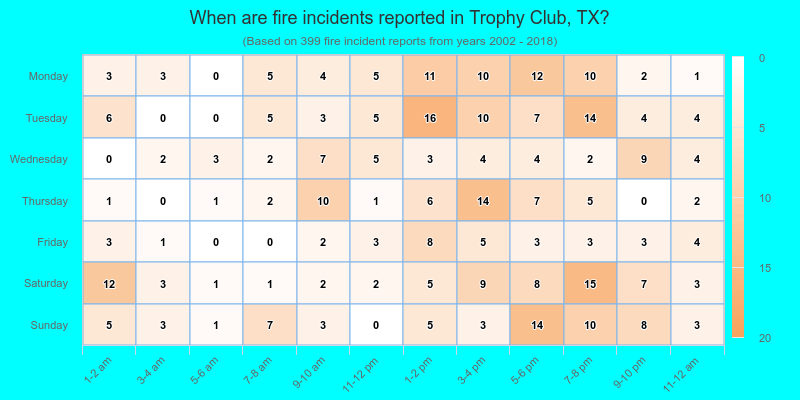
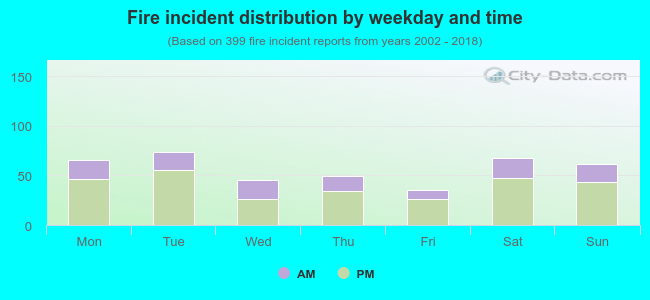 30.6% incidents where reported in the morning and 69.4% in the evening. The most fires (18.5%) took place on Tuesday, and the least (8.8%) on Friday.
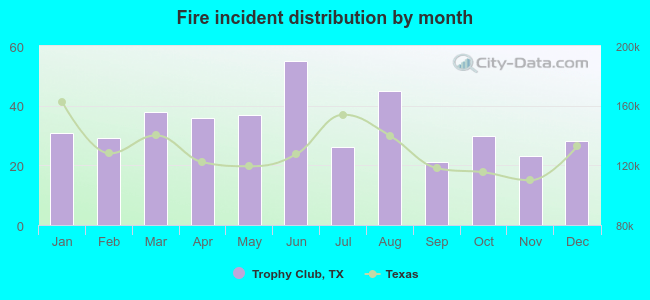 Based on the 399 fire incident reports from years 2002 - 2018 most fires (13.8%) took place during June, and the least (5.3%) in September.
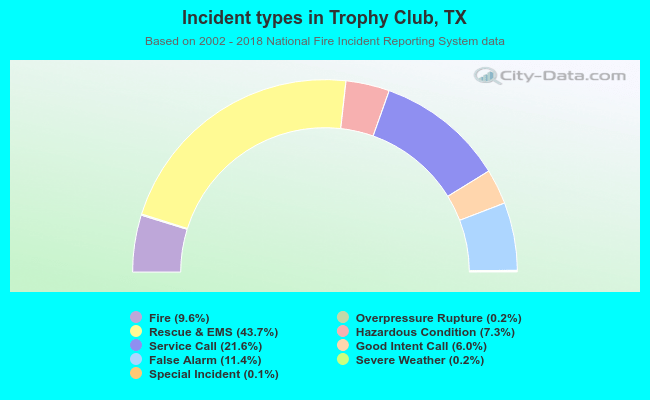 Out of all 4,168 cases reported during the years 2002 - 2018, the most belonged to the categories: Rescue & EMS (43.7%), Service Call (21.6%), and False Alarm (11.4%).
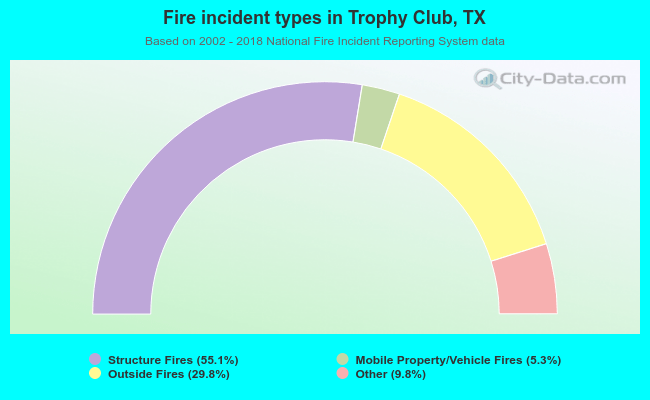 When looking into fire subcategories, the most incidents belonged to: Structure Fires (55.1%), and Outside Fires (29.8%).