Tolland: Fire Incidents, Connecticut (CT)
Where are fire incidents reported in Tolland, CT
Something went wrong! Please refresh the page.
|
| |||||||||||||||||||||||||||||||||||||||||||||||||||||||||||||||||||||||||||||||||||||||||||||||||||||||||||||
2002 - 2018 National Fire Incident Reporting System (NFIRS) incidents
- Incident types reported to NFIRS in Tolland, CT
- 4,68464.7%Rescue & EMS
- 93212.9%Hazardous Condition
- 5317.3%Fire
- 5267.3%False Alarm
- 3715.1%Service Call
- 1542.1%Good Intent Call
- 240.3%Severe Weather
- 150.2%Special Incident
- Fire incident types reported to NFIRS in Tolland, CT
- 28553.7%Structure Fires
- 12824.1%Outside Fires
- 10219.2%Mobile Property/Vehicle Fires
- 163.0%Other
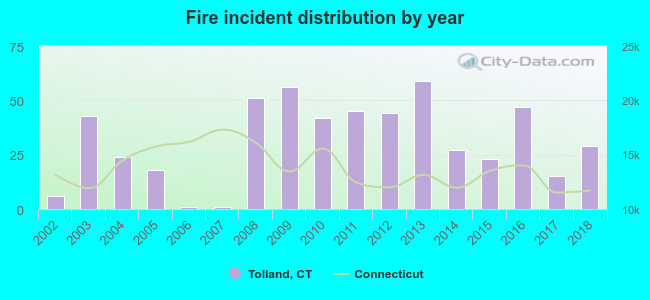 According to the data from the years 2002 - 2018 the average number of fire incidents per year is 31. The highest number of reported fires - 59 took place in 2013, and the least - 1 in 2006. The data has a rising trend.
The average number of yearly fire incidents per 10k residents in Tolland, CT compared to nearest cities:
(Note: Based on data for the last 3 years, including only cities with population 5,000 and above)
| Tolland: | 20.2 |
| Ellington: | 14.3 |
| Willington: | 14.3 |
| Vernon: | 18.4 |
| Coventry: | 10.2 |
| Stafford: | 10.2 |
| Storrs: | 26.1 |
| Mansfield: | 6.8 |
| Somers: | 25.6 |
 The median response time based on all reported fire incidents is 8 minutes. This is higher compared to the state median value.
The median response time in Tolland, CT compared to nearest cities:
(Note: Based on data for all years, including only cities with at least 500 fire incidents)
| Tolland: | 8 minutes |
| Ellington: | 6 minutes |
| Vernon: | 5 minutes |
| Coventry: | 7 minutes |
| Somers: | 6 minutes |
| South Windsor: | 7 minutes |
| Manchester: | 4 minutes |
| Enfield: | 4 minutes |
| Willimantic: | 4 minutes |
 29.8% incidents where reported in the morning and 70.2% in the evening. The most fires (16.4%) took place on Monday, and the least (11.9%) on Thursday.
 Based on the 531 fire incidents from years 2002 - 2018 most fires (12.6%) took place during April, and the least (4.9%) in June.
 Out of all 7,242 cases reported during the years 2002 - 2018, the most belonged to the categories: Rescue & EMS (64.7%), Hazardous Condition (12.9%), and Fire (7.3%).
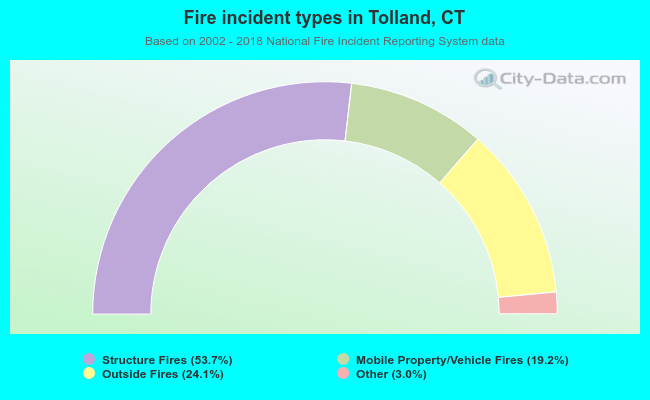 When looking into fire subcategories, the most incidents belonged to: Structure Fires (53.7%), and Outside Fires (24.1%).