Troy: Fire Incidents, Michigan (MI)
Where are fire incidents reported in Troy, MI
Something went wrong! Please refresh the page.
| Fire incidents reported | |
|---|---|
| Sreet name | Count |
| BIG BEAVER RD | 268 |
| MAPLE RD | 250 |
| ROCHESTER RD | 242 |
| JOHN | 140 |
| I75 | 126 |
| LIVERNOIS AVE | 106 |
| CROOKS RD | 104 |
| FOURTEEN MILE RD | 94 |
| BIGBEAVER RD | 92 |
| COOLIDGE HWY | 90 |
| STEPHENSON HWY | 84 |
| KIRTS BLVD | 78 |
| LONG LAKE RD | 70 |
| COACHMAN DR | 68 |
| DEQUINDRE RD | 58 |
| WATTLES RD | 56 |
| JOHNR RD | 48 |
| SQUARE LAKE RD | 46 |
| LOVINGTON | 40 |
| CHARTER | 38 |
| SOUTH BLVD | 38 |
| JOHN R RD | 36 |
| GOLFVIEW DR | 34 |
| SOMERSET BLVD | 34 |
| I75 OFRP | 32 |
| FOURTEENMILE RD | 30 |
| I75 NO CROOKS | 30 |
| NORTHFIELD PARKWAY | 30 |
| I75 SO ADAMS | 28 |
| BEACH RD | 26 |
| Other | 366 |
2002 - 2018 National Fire Incident Reporting System (NFIRS) incidents
- Incident types reported to NFIRS in Troy, MI
- 2,78228.9%Fire
- 2,61827.2%Hazardous Condition
- 2,58426.8%False Alarm
- 1,09211.3%Good Intent Call
- 2632.7%Service Call
- 2392.5%Rescue & EMS
- 260.3%Severe Weather
- 160.2%Overpressure Rupture
- Fire incident types reported to NFIRS in Troy, MI
- 1,15141.4%Structure Fires
- 84030.2%Outside Fires
- 71725.8%Mobile Property/Vehicle Fires
- 742.7%Other
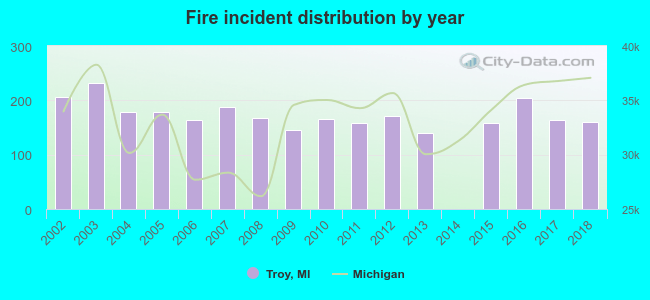 Based on the data from the years 2002 - 2018 the average number of fire incidents per year is 164. The highest number of reported fire incidents - 232 took place in 2003, and the least - 0 in 2014. The data has a decreasing trend.
The average number of yearly fire incidents per 10k residents in Troy, MI compared to nearest cities:
(Note: Based on data for the last 3 years, including only cities with population 5,000 and above)
| Troy: | 21.2 |
| Clawson: | 16.0 |
| Birmingham: | 15.9 |
| Royal Oak: | 15.8 |
| Madison Heights: | 39.0 |
| Sterling Heights: | 18.3 |
| Rochester Hills: | 16.9 |
| Beverly Hills: | 23.9 |
| Berkley: | 19.4 |
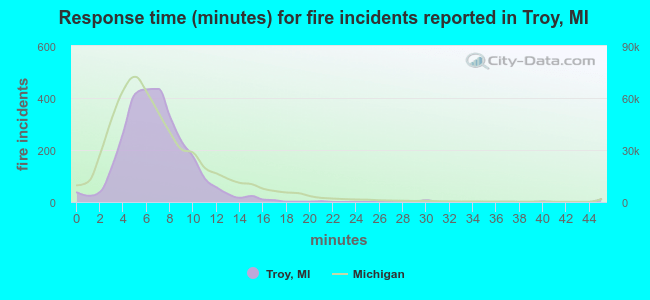 The median response time based on all reported fire incidents is 7 minutes. This is about the same as the state median value.
The median response time in Troy, MI compared to nearest cities:
(Note: Based on data for all years, including only cities with at least 500 fire incidents)
| Troy: | 7 minutes |
| Royal Oak: | 6 minutes |
| Madison Heights: | 3 minutes |
| Sterling Heights: | 5 minutes |
| Rochester Hills: | 6 minutes |
| Auburn Hills: | 7 minutes |
| Oak Park: | 3 minutes |
| Ferndale: | 4 minutes |
| Warren: | 5 minutes |
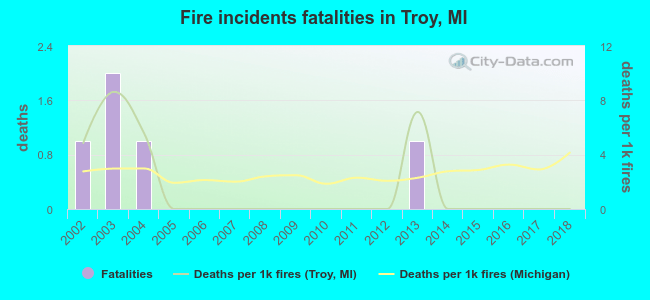 Based on the reports from the years 2002 - 2018 the average number of fire-related fatalities per year is 0. The highest number of deaths - 2 took place in 2003, and the lowest - 0 in 2005. The data has a decreasing trend.
The average number of deaths per 1,000 fire incidents is 2. This indicator was the highest - 9 in 2003, and the lowest 0 in 2005. The trend for deaths per 1,000 incidents is dropping. Compared to the state value the number of deaths per 1,000 incidents is lower.
Based on the reports from the years 2002 - 2018 the average number of fire-related fatalities per year is 0. The highest number of deaths - 2 took place in 2003, and the lowest - 0 in 2005. The data has a decreasing trend.
The average number of deaths per 1,000 fire incidents is 2. This indicator was the highest - 9 in 2003, and the lowest 0 in 2005. The trend for deaths per 1,000 incidents is dropping. Compared to the state value the number of deaths per 1,000 incidents is lower.Deaths per 1,000 incidents in Troy, MI compared to nearest cities:
(Note: Based on data for all years, including only cities with at least 2,500 fire incidents)
| Troy: | 1.8 |
| Sterling Heights: | 2.4 |
| Warren: | 2.2 |
| Southfield: | 3.1 |
| Pontiac: | 3.8 |
| Roseville: | 3.9 |
| Detroit: | 2.2 |
| Dearborn: | 1.8 |
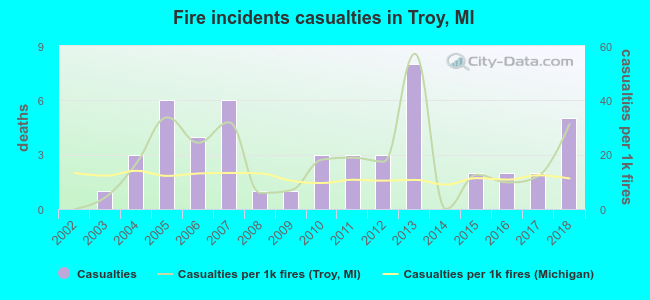 Based on the data from the years 2002 - 2018 the average number of fire-related casualties per year is 3. The highest number of casualties - 8 took place in 2013, and the lowest - 0 in 2002. The data has a growing trend.
The average number of injuries per 1,000 fire incidents is 18. This indicator was the highest - 57 in 2013, and the lowest 0 in 2002. The trend for injuries per 1,000 fires is growing. Compared to the Michigan value the number of casualties per 1,000 incidents is higher.
Based on the data from the years 2002 - 2018 the average number of fire-related casualties per year is 3. The highest number of casualties - 8 took place in 2013, and the lowest - 0 in 2002. The data has a growing trend.
The average number of injuries per 1,000 fire incidents is 18. This indicator was the highest - 57 in 2013, and the lowest 0 in 2002. The trend for injuries per 1,000 fires is growing. Compared to the Michigan value the number of casualties per 1,000 incidents is higher.Casualties per 1,000 incidents in Troy, MI compared to nearest cities:
(Note: Based on data for all years, including only cities with at least 500 fire incidents)
| Troy: | 18.0 |
| Royal Oak: | 24.1 |
| Madison Heights: | 10.5 |
| Sterling Heights: | 49.4 |
| Rochester Hills: | 28.1 |
| Auburn Hills: | 11.1 |
| Oak Park: | 9.2 |
| Ferndale: | 33.1 |
| Warren: | 24.1 |
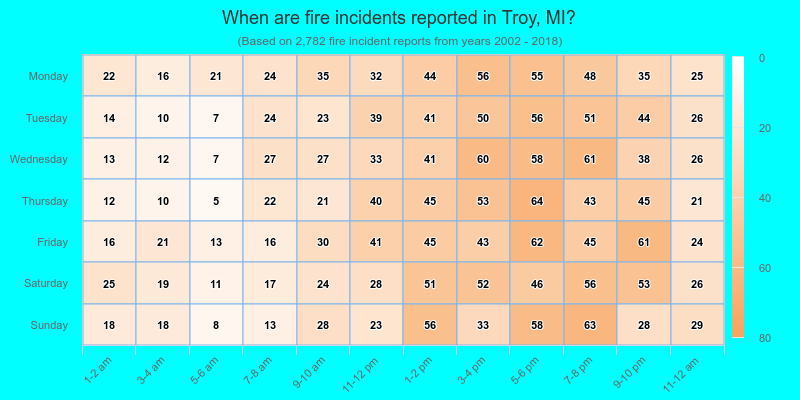
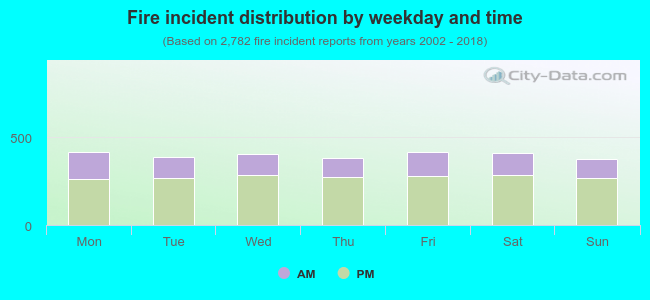 31.1% incidents where reported in the morning and 68.9% in the evening. The most fires (15.0%) took place on Friday, and the least (13.5%) on Sunday.
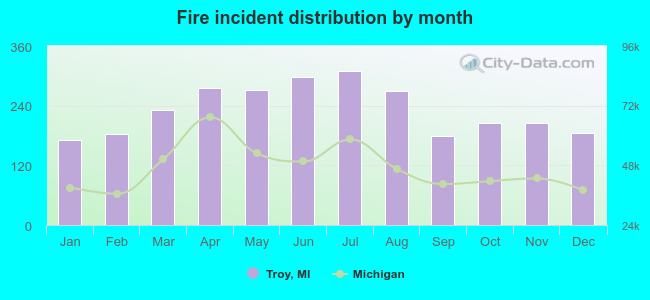 According to the 2,782 fire incidents from years 2002 - 2018 most fires (11.1%) took place during July, and the least (6.1%) in January.
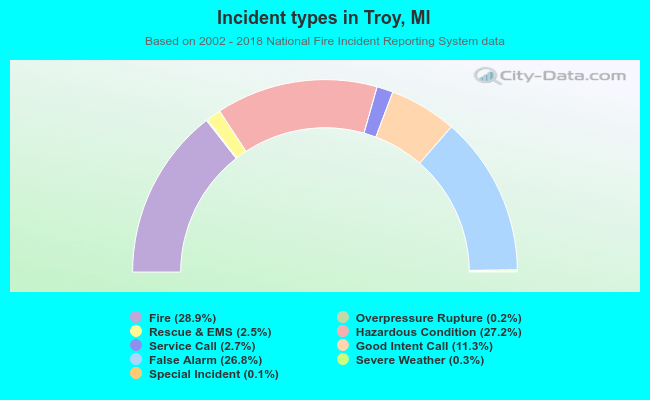 Out of all 9,625 cases reported during the years 2002 - 2018, the most belonged to the categories: Fire (28.9%), Hazardous Condition (27.2%), and False Alarm (26.8%).
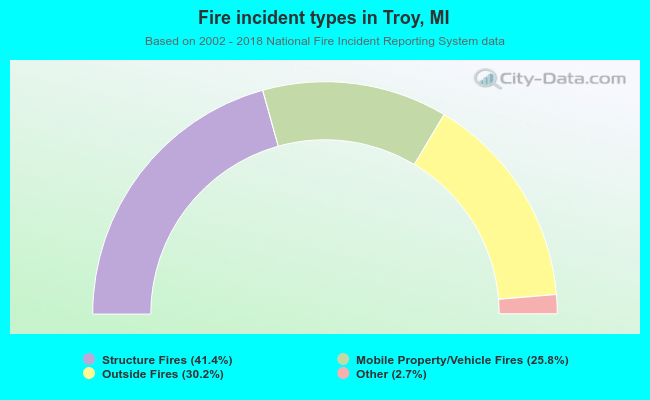 When looking into fire subcategories, the most incidents belonged to: Structure Fires (41.4%), and Outside Fires (30.2%).