Tyngsborough: Fire Incidents, Massachusetts (MA)
Where are fire incidents reported in Tyngsborough, MA
Something went wrong! Please refresh the page.
|
| |||||||||||||||||||||||||||||||||||||||||||||||||||||||||||||||||||||||||||||||||||||||||||||||||||||||||||||
2002 - 2018 National Fire Incident Reporting System (NFIRS) incidents
- Incident types reported to NFIRS in Tyngsborough, MA
- 3,65242.3%Rescue & EMS
- 1,91622.2%Hazardous Condition
- 1,12713.1%False Alarm
- 1,03212.0%Service Call
- 4935.7%Fire
- 4004.6%Good Intent Call
- Fire incident types reported to NFIRS in Tyngsborough, MA
- 21443.4%Outside Fires
- 13828.0%Structure Fires
- 11122.5%Mobile Property/Vehicle Fires
- 306.1%Other
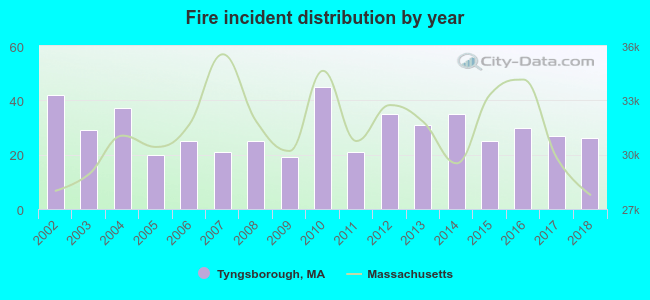 Based on the data from the years 2002 - 2018 the average number of fires per year is 29. The highest number of reported fires - 45 took place in 2010, and the least - 19 in 2009. The data has a decreasing trend.
The average number of yearly fire incidents per 10k residents in Tyngsborough, MA compared to nearest cities:
(Note: Based on data for the last 3 years, including only cities with population 5,000 and above)
| Tyngsborough: | 24.5 |
| Dracut: | 20.3 |
| Chelmsford: | 12.3 |
| Westford: | 26.0 |
| Lowell: | 41.4 |
| Littleton: | 35.5 |
| Tewksbury: | 29.8 |
| Billerica: | 27.3 |
| Methuen: | 26.7 |

 According to the data from the years 2002 - 2018 the average number of fire-related yearly casualties is 1. The highest number of reported casualties - 3 took place in 2008, and the lowest - 0 in 2002. The data has an increasing trend.
 31.0% incidents where reported in the morning and 69.0% in the evening. The most fires (18.1%) took place on Monday, and the least (12.6%) on Sunday.
 According to the 493 incident reports from years 2002 - 2018 most fires (17.2%) took place during April, and the least (4.7%) in December.
 Out of all 8,633 cases reported during the years 2002 - 2018, the most belonged to the categories: Rescue & EMS (42.3%), Hazardous Condition (22.2%), and False Alarm (13.1%).
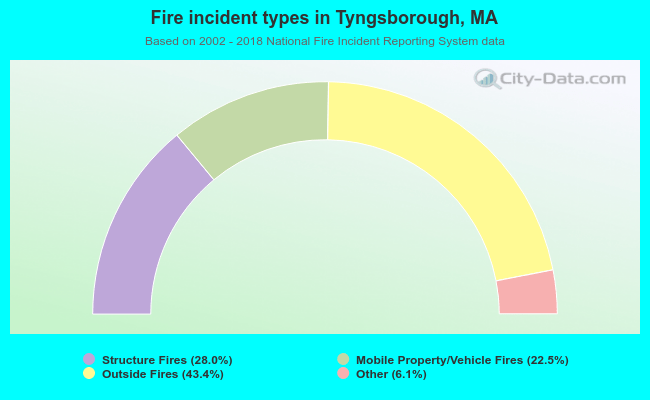 When looking into fire subcategories, the most incidents belonged to: Outside Fires (43.4%), and Structure Fires (28.0%).