Vacaville: Fire Incidents, California (CA)
Where are fire incidents reported in Vacaville, CA
Something went wrong! Please refresh the page.
| Fire incidents reported | |
|---|---|
| Sreet name | Count |
| ALAMO DR | 206 |
| I80 | 192 |
| I80 IN | 186 |
| PEABODY RD | 178 |
| CALIFORNIA DR | 120 |
| MARSHALL RD | 108 |
| NUT TREE RD | 86 |
| ORANGE DR | 82 |
| LEISURE TOWN RD | 64 |
| PLEASANTS VALLEY RD | 64 |
| MONTE VISTA AV | 56 |
| BROWN ST | 54 |
| MONTE VISTA | 54 |
| ELMIRA RD | 52 |
| MASON ST | 50 |
| DAVIS ST | 48 |
| MONTE VISTA AVE | 46 |
| HARBISON DR | 44 |
| VANDEN RD | 42 |
| CALLEN ST | 40 |
| MERCHANT ST | 38 |
| ALLISON DR | 36 |
| BEELARD DR | 32 |
| CHERRY GLEN RD | 32 |
| I-505 HWY | 32 |
| MIX CANYON RD | 32 |
| ROCKY HILL RD | 30 |
| AEGEAN WAY | 28 |
| I505 IN | 28 |
| LAGOON VALLEY RD | 28 |
| Other | 734 |
2005 - 2018 National Fire Incident Reporting System (NFIRS) incidents
- Incident types reported to NFIRS in Vacaville, CA
- 22,05066.0%Rescue & EMS
- 3,1989.6%Service Call
- 3,0099.0%Good Intent Call
- 2,8228.4%Fire
- 1,2233.7%False Alarm
- 1,0243.1%Hazardous Condition
- 530.2%Overpressure Rupture
- Fire incident types reported to NFIRS in Vacaville, CA
- 1,64458.3%Outside Fires
- 73225.9%Structure Fires
- 35412.5%Mobile Property/Vehicle Fires
- 923.3%Other
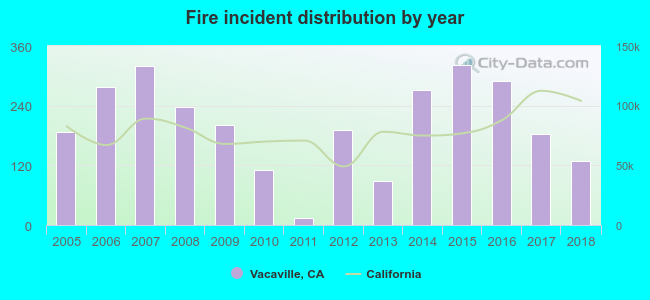 Based on the data from the years 2005 - 2018 the average number of fires per year is 202. The highest number of reported fires - 321 took place in 2015, and the least - 15 in 2011. The data has a dropping trend.
The average number of yearly fire incidents per 10k residents in Vacaville, CA compared to nearest cities:
(Note: Based on data for the last 3 years, including only cities with population 5,000 and above)
| Vacaville: | 20.9 |
| Suisun City: | 23.7 |
| Fairfield: | 9.0 |
| Dixon: | 3.7 |
| Winters: | 58.1 |
| Napa: | 27.3 |
| Davis: | 12.8 |
| American Canyon: | 14.5 |
| Rio Vista: | 52.9 |
 The median response time based on all reported fire incidents is 7 minutes. This is comparable to the state median value.
The median response time in Vacaville, CA compared to nearest cities:
(Note: Based on data for all years, including only cities with at least 500 fire incidents)
| Vacaville: | 7 minutes |
| Suisun City: | 5 minutes |
| Fairfield: | 7 minutes |
| Dixon: | 8 minutes |
| Napa: | 6 minutes |
| Davis: | 6 minutes |
| American Canyon: | 5 minutes |
| Rio Vista: | 7 minutes |
| Vallejo: | 5 minutes |
 Based on the reports from the years 2005 - 2018 the average number of fire-related yearly casualties is 1. The highest number of reported injuries - 5 took place in 2007, and the lowest - 0 in 2009. The data has a dropping trend.
The average number of injuries per 1,000 fire incidents is 19. This indicator was the highest - 200 in 2011, and the lowest 0 in 2009. The trend for injuries per 1,000 incidents is decreasing. Compared to the state value the number of casualties per 1,000 incidents is similar.
Based on the reports from the years 2005 - 2018 the average number of fire-related yearly casualties is 1. The highest number of reported injuries - 5 took place in 2007, and the lowest - 0 in 2009. The data has a dropping trend.
The average number of injuries per 1,000 fire incidents is 19. This indicator was the highest - 200 in 2011, and the lowest 0 in 2009. The trend for injuries per 1,000 incidents is decreasing. Compared to the state value the number of casualties per 1,000 incidents is similar.Casualties per 1,000 incidents in Vacaville, CA compared to nearest cities:
(Note: Based on data for all years, including only cities with at least 500 fire incidents)
| Vacaville: | 6.4 |
| Suisun City: | 0.0 |
| Fairfield: | 2.6 |
| Dixon: | 5.0 |
| Napa: | 9.9 |
| Davis: | 10.4 |
| American Canyon: | 1.7 |
| Rio Vista: | 3.3 |
| Vallejo: | 5.0 |
 29.1% incidents where reported in the morning and 70.9% in the evening. The most fires (15.5%) took place on Tuesday, and the least (13.3%) on Monday.
 According to the 2,822 fire incident reports from years 2005 - 2018 most fires (15.2%) took place during July, and the least (4.4%) in February.
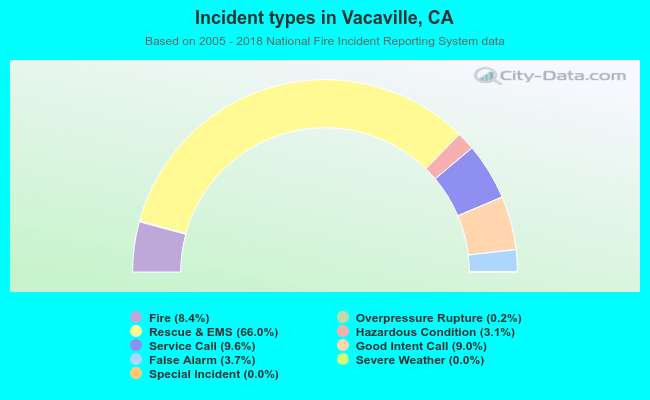 Out of all 33,400 cases reported during the years 2005 - 2018, the most belonged to the categories: Rescue & EMS (66.0%), Service Call (9.6%), and Good Intent Call (9.0%).
 When looking into fire subcategories, the most reports belonged to: Outside Fires (58.3%), and Structure Fires (25.9%).