Winters: Fire Incidents, California (CA)
Where are fire incidents reported in Winters, CA
Something went wrong! Please refresh the page.
|
| |||||||||||||||||||||||||||||||||||||||||||||||||||||||||||||||||||||||||||||||||||||||||||||||||||||||||||||
2005 - 2018 National Fire Incident Reporting System (NFIRS) incidents
- Incident types reported to NFIRS in Winters, CA
- 51735.1%Rescue & EMS
- 46831.8%Fire
- 18812.8%Good Intent Call
- 1188.0%Service Call
- 1067.2%Hazardous Condition
- 654.4%False Alarm
- 50.3%Special Incident
- 30.2%Severe Weather
- Fire incident types reported to NFIRS in Winters, CA
- 33070.5%Outside Fires
- 8518.2%Structure Fires
- 367.7%Mobile Property/Vehicle Fires
- 173.6%Other
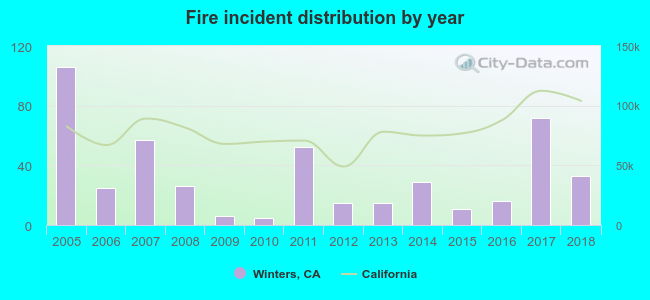 According to the data from the years 2005 - 2018 the average number of fires per year is 33. The highest number of reported fire incidents - 106 took place in 2005, and the least - 5 in 2010. The data has a dropping trend.
The average number of yearly fire incidents per 10k residents in Winters, CA compared to nearest cities:
(Note: Based on data for the last 3 years, including only cities with population 5,000 and above)
| Winters: | 58.1 |
| Dixon: | 3.7 |
| Vacaville: | 20.9 |
| Davis: | 12.8 |
| Woodland: | 44.1 |
| Fairfield: | 9.0 |
| Suisun City: | 23.7 |
| Napa: | 27.3 |
| West Sacramento: | 58.9 |

 28.6% incidents where reported in the morning and 71.4% in the evening. The most fires (17.5%) took place on Thursday, and the least (10.9%) on Sunday.
 According to the 468 fires from years 2005 - 2018 most fires (18.2%) took place during July, and the least (4.1%) in January.
 Out of all 1,471 cases reported during the years 2005 - 2018, the most belonged to the categories: Rescue & EMS (35.1%), Fire (31.8%), and Good Intent Call (12.8%).
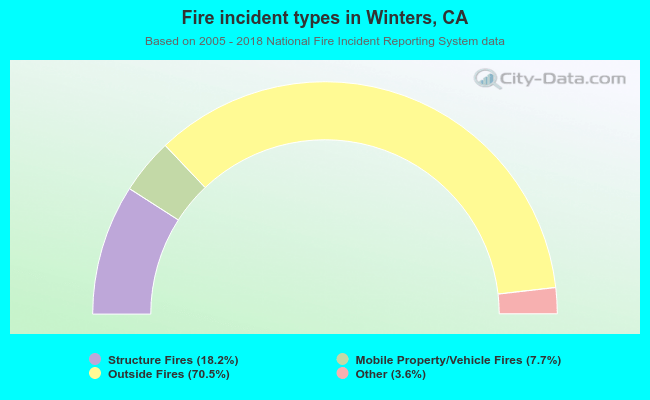 When looking into fire subcategories, the most reports belonged to: Outside Fires (70.5%), and Structure Fires (18.2%).