Venice: Fire Incidents, Florida (FL)
Where are fire incidents reported in Venice, FL
Something went wrong! Please refresh the page.
| Fire incidents reported | |
|---|---|
| Sreet name | Count |
| TAMIAMI TRL | 206 |
| VENICE AVE | 206 |
| I75 | 146 |
| HARBOR DR | 72 |
| PINEBROOK RD | 50 |
| US 41 BYP | 48 |
| US 41 BYPASS | 48 |
| GROVE ST | 40 |
| LAUREL RD | 40 |
| TAMIAMI | 40 |
| TARPON CENTER DR | 38 |
| LAUREL AVE | 32 |
| OUT OF NOKOMIS AREA | 32 |
| JACARANDA BLVD | 28 |
| NOKOMIS AVE | 28 |
| THE RIALTO | 28 |
| AIRPORT AVE | 26 |
| CAPRI ISLES BLVD | 26 |
| GROVELAND AVE | 20 |
| KNIGHTS TRAIL RD | 20 |
| ALBEE FARM RD | 18 |
| WARFIELD AVE | 18 |
| BASE AVE | 16 |
| CYPRESS AVE | 16 |
| GULF COAST BLVD | 16 |
| PLAZA MAYOR | 16 |
| SHAMROCK DR | 16 |
| LUCAYA AVE | 14 |
| RIDGEWOOD AVE | 14 |
| SEABOARD AVE | 14 |
| Other | 175 |
2002 - 2018 National Fire Incident Reporting System (NFIRS) incidents
- Incident types reported to NFIRS in Venice, FL
- 34,10879.6%Rescue & EMS
- 3,0297.1%Good Intent Call
- 1,7794.1%False Alarm
- 1,5073.5%Fire
- 1,3603.2%Hazardous Condition
- 1,0272.4%Service Call
- Fire incident types reported to NFIRS in Venice, FL
- 84456.0%Outside Fires
- 37124.6%Structure Fires
- 24015.9%Mobile Property/Vehicle Fires
- 523.5%Other
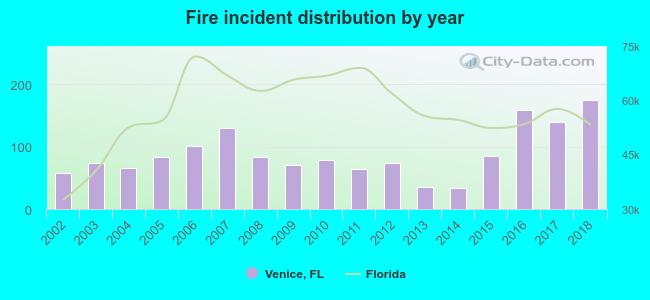 According to the data from the years 2002 - 2018 the average number of fire incidents per year is 89. The highest number of fires - 174 took place in 2018, and the least - 34 in 2014. The data has an increasing trend.
The average number of yearly fire incidents per 10k residents in Venice, FL compared to nearest cities:
(Note: Based on data for the last 3 years, including only cities with population 5,000 and above)
| Venice: | 72.4 |
| South Venice: | 1.4 |
| Osprey: | 8.2 |
| Englewood: | 20.0 |
| Warm Mineral Springs: | 14.8 |
| North Port: | 36.2 |
| Sarasota: | 56.6 |
| Rotonda: | 5.3 |
| Port Charlotte: | 59.1 |
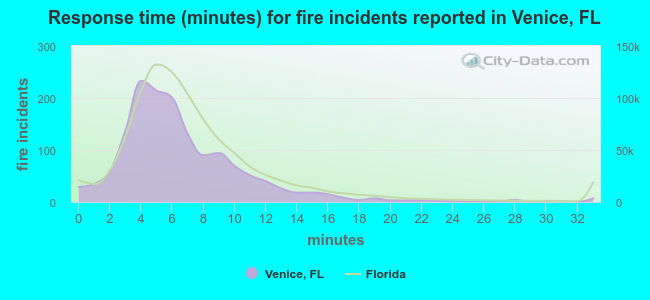 The median response time based on all reported fire incidents is 6 minutes. This is comparable to the state median value.
The median response time in Venice, FL compared to nearest cities:
(Note: Based on data for all years, including only cities with at least 500 fire incidents)
| Venice: | 6 minutes |
| Nokomis: | 6 minutes |
| Englewood: | 6 minutes |
| North Port: | 7 minutes |
| Sarasota: | 6 minutes |
| Port Charlotte: | 6 minutes |
| Punta Gorda: | 7 minutes |
| Bradenton: | 5 minutes |
| Palmetto: | 6 minutes |
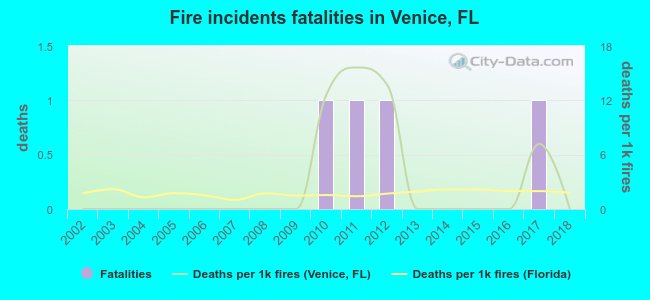 Based on the data from the years 2002 - 2018 the average number of fire-related yearly deaths is 0. The highest number of reported deaths - 1 took place in 2010, and the lowest - 0 in 2002. The data has a constant trend.
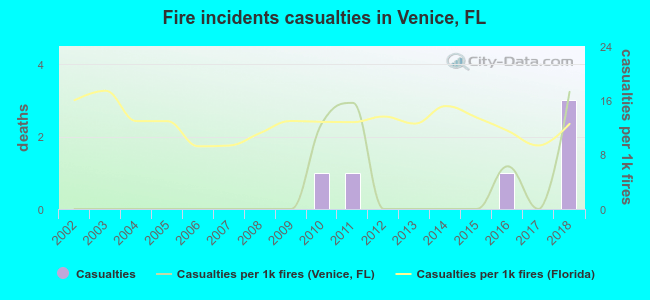 According to the reports from the years 2002 - 2018 the average number of fire-related yearly casualties is 0. The highest number of reported injuries - 3 took place in 2018, and the lowest - 0 in 2002. The data has a rising trend.
The average number of injuries per 1,000 fire incidents is 3. This indicator was the highest - 17 in 2018, and the lowest 0 in 2002. The trend for casualties per 1,000 fire incidents is increasing. Compared to the state value the number of casualties per 1,000 incidents is much lower.
According to the reports from the years 2002 - 2018 the average number of fire-related yearly casualties is 0. The highest number of reported injuries - 3 took place in 2018, and the lowest - 0 in 2002. The data has a rising trend.
The average number of injuries per 1,000 fire incidents is 3. This indicator was the highest - 17 in 2018, and the lowest 0 in 2002. The trend for casualties per 1,000 fire incidents is increasing. Compared to the state value the number of casualties per 1,000 incidents is much lower.Casualties per 1,000 incidents in Venice, FL compared to nearest cities:
(Note: Based on data for all years, including only cities with at least 500 fire incidents)
| Venice: | 4.0 |
| Nokomis: | 3.6 |
| Englewood: | 2.0 |
| North Port: | 4.3 |
| Sarasota: | 6.5 |
| Port Charlotte: | 13.3 |
| Punta Gorda: | 5.3 |
| Bradenton: | 6.2 |
| Palmetto: | 9.1 |
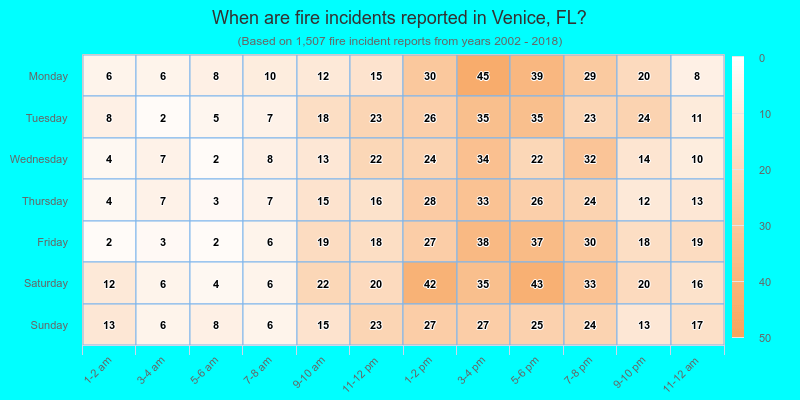
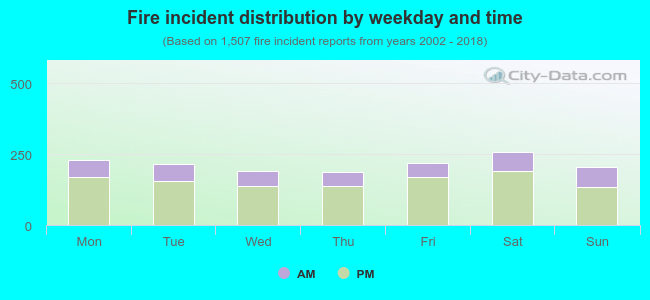 27.8% incidents where reported in the morning and 72.2% in the evening. The most fires (17.2%) took place on Saturday, and the least (12.5%) on Thursday.
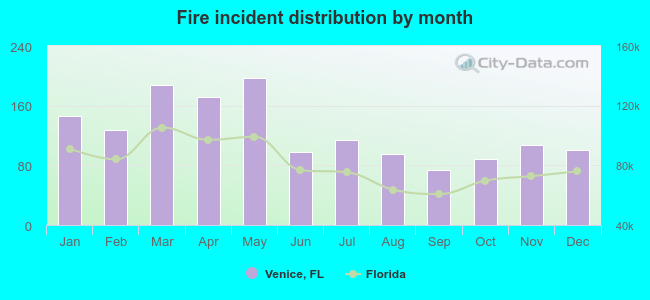 According to the 1,507 incident reports from years 2002 - 2018 most fires (13.1%) took place during May, and the least (4.9%) in September.
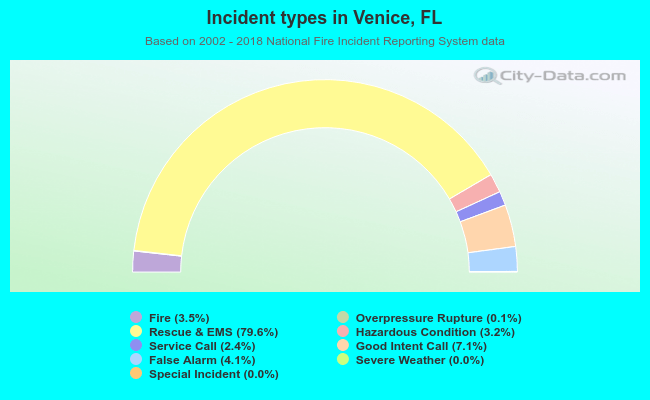 Out of all 42,870 cases reported during the years 2002 - 2018, the most belonged to the categories: Rescue & EMS (79.6%), Good Intent Call (7.1%), and False Alarm (4.1%).
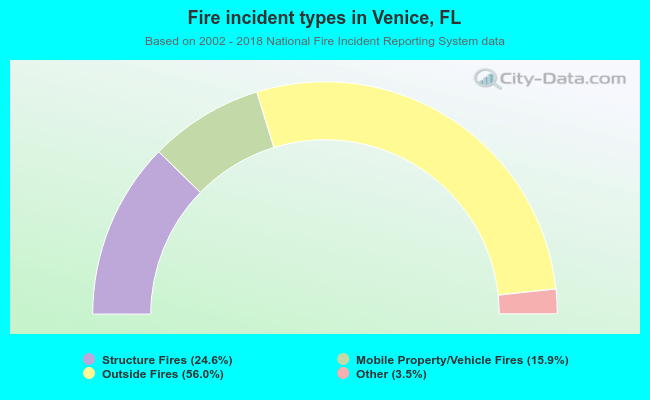 When looking into fire subcategories, the most reports belonged to: Outside Fires (56.0%), and Structure Fires (24.6%).