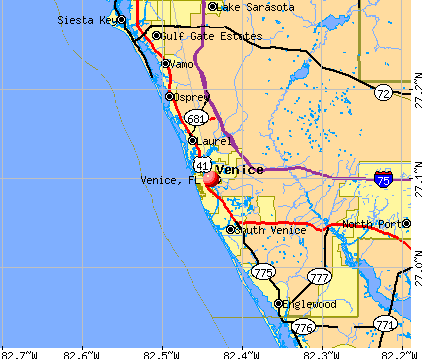
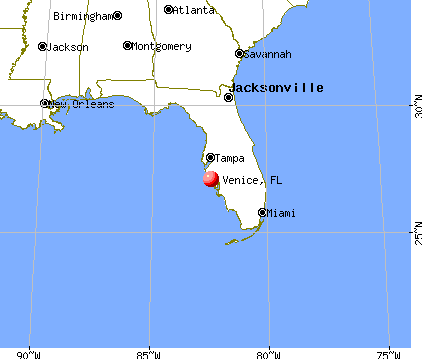
Venice, Florida
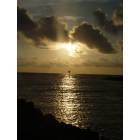
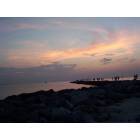
Venice: Venice at Sunset
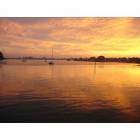
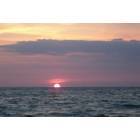
Venice: Sunrise at Venice
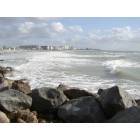
Venice: Venice Beach after Tropical Storm Gamma
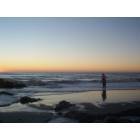
Venice: Last day of 2005
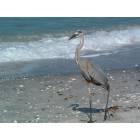
Venice: waterbird at Casperson Beach
Venice: Venice Jetties December 2005
Venice: Two sandhill cranes crossing the road
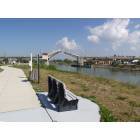
Venice: Circus Bridge from Bench on the Venetian Waterway
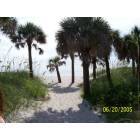
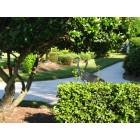
Venice: walkway to beach
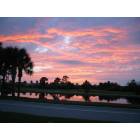
Venice: Florida Sunset at Pelican Point Country Club Subdivison
Venice: Tranquil Moments
- see
62
more - add
your


Submit your own pictures of this city and show them to the world
- OSM Map
- General Map
- Google Map
- MSN Map
Population change since 2000: +53.5%
 |
| Males: 12,132 | |
| Females: 15,140 |
| Median resident age: | 69.3 years |
| Florida median age: | 42.7 years |
Zip codes: 34292.
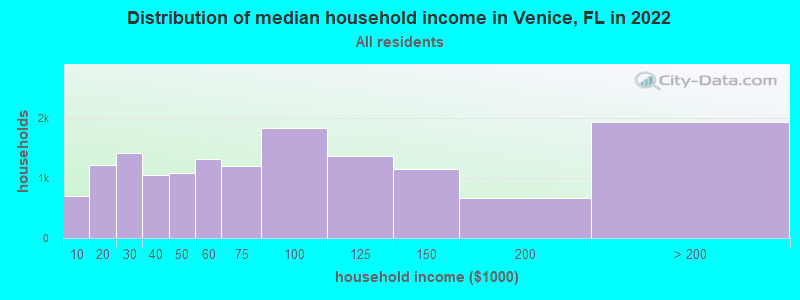
| Venice: | $69,849 |
| FL: | $69,303 |
Estimated per capita income in 2022: $72,172 (it was $28,220 in 2000)
Venice city income, earnings, and wages data
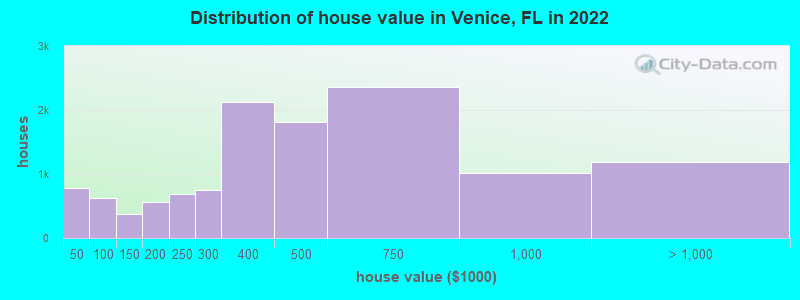
Estimated median house or condo value in 2022: $411,266 (it was $102,100 in 2000)
| Venice: | $411,266 |
| FL: | $354,100 |
Mean prices in 2022: all housing units: $678,165; detached houses: $948,482; townhouses or other attached units: $358,318; in 2-unit structures: $278,587; in 3-to-4-unit structures: $279,045; in 5-or-more-unit structures: $467,054; mobile homes: $147,157
Median gross rent in 2022: $1,583.
(7.7% for White Non-Hispanic residents, 31.5% for Black residents, 8.4% for Hispanic or Latino residents, 35.3% for American Indian residents, 28.9% for Native Hawaiian and other Pacific Islander residents, 12.9% for other race residents, 1.6% for two or more races residents)
Detailed information about poverty and poor residents in Venice, FL


Compare current foreclosures in Venice, FL:
| Photo | Address | Area | Beds / Baths | Price | Details |
|---|---|---|---|---|---|

|
#1
Gull Rd
Venice, FL 34293
|
1,101 sq. feet
|
2 baths 2 beds |
$349,900
|
show details |

|
#2
Nectar Rd
Venice, FL 34293
|
1,530 sq. feet
|
2 baths 2 beds |
show details | |

|
#3
Lemon Bay Dr
Venice, FL 34293
|
2,168 sq. feet
|
2 baths 3 beds |
show details | |

|
#4
Cypress Ave
Venice, FL 34285
|
750 sq. feet
|
1 baths 2 beds |
show details | |

|
#5
E Douglas Ct
Venice, FL 34293
|
1,589 sq. feet
|
2 baths 2 beds |
show details | |

|
#6
Shamrock Dr
Venice, FL 34293
|
1,303 sq. feet
|
2 baths 3 beds |
show details | |

|
#7
Base Ave E Apt 211
Venice, FL 34285
|
716 sq. feet
|
1 baths 2 beds |
show details | |

|
#8
Shamrock Dr
Venice, FL 34293
|
2,464 sq. feet
|
2 baths 1 beds |
show details | |

|
#9
San Silvestro Dr
Venice, FL 34285
|
1,402 sq. feet
|
2 baths 2 beds |
show details | |

|
#10
Mobile Rd
Venice, FL 34293
|
901 sq. feet
|
1 baths 2 beds |
show details |
| Photo | Address | Area | Beds / Baths | Price | Details |
|---|---|---|---|---|---|

|
#11
Foxglove Rd
Venice, FL 34293
|
1,299 sq. feet
|
1 baths 2 beds |
show details | |

|
#12
Jacaranda Blvd
Venice, FL 34292
|
2,446 sq. feet
|
2 baths 3 beds |
show details | |

|
#13
Ruby Rd
Venice, FL 34293
|
1,387 sq. feet
|
2 baths 2 beds |
show details | |

|
#14
Sklar Dr W
Venice, FL 34293
|
2,402 sq. feet
|
3 baths 5 beds |
show details | |

|
#15
Albee Farm Rd Apt 204
Venice, FL 34285
|
902 sq. feet
|
2 baths 2 beds |
show details | |

|
#16
E Village Ct
Venice, FL 34293
|
1,198 sq. feet
|
2 baths 2 beds |
show details | |

|
#17
Beverly Rd
Venice, FL 34293
|
2,045 sq. feet
|
2 baths 3 beds |
show details | |

|
#18
Rigel Rd
Venice, FL 34293
|
1,183 sq. feet
|
2 baths 2 beds |
show details | |

|
#19
Datura Rd
Venice, FL 34293
|
1,624 sq. feet
|
2 baths 3 beds |
show details | |

|
#20
Lagente Cir
Venice, FL 34293
|
- sq. feet
|
- baths - beds |
show details |
| Photo | Address | Area | Beds / Baths | Price | Details |
|---|---|---|---|---|---|

|
#21
Venice Ave W Unit 1595
Venice, FL 34284
|
- sq. feet
|
- baths - beds |
show details | |

|
#22
Sheridan Dr
Venice, FL 34293
|
- sq. feet
|
- baths - beds |
show details | |

|
#23
Bird Bay Dr E Apt 202
Venice, FL 34285
|
- sq. feet
|
- baths - beds |
show details | |

|
#24
Northampton St
Venice, FL 34293
|
- sq. feet
|
- baths - beds |
show details | |

|
#25
Leeward Rd
Venice, FL 34293
|
- sq. feet
|
- baths - beds |
show details | |

|
#26
Key Lime Dr
Venice, FL 34292
|
- sq. feet
|
- baths - beds |
show details | |

|
#27
Okaloosa Dr
Venice, FL 34293
|
- sq. feet
|
- baths - beds |
show details | |

|
#28
Maseno Dr
Venice, FL 34292
|
- sq. feet
|
- baths - beds |
show details | |

|
#29
E Venice Ave Unit B
Venice, FL 34285
|
- sq. feet
|
- baths - beds |
show details | |

|
#30
Tamiami Trl S
Venice, FL 34293
|
- sq. feet
|
- baths - beds |
show details |
| Photo | Address | Area | Beds / Baths | Price | Details |
|---|---|---|---|---|---|

|
#31
Cordana Ct
Venice, FL 34292
|
- sq. feet
|
- baths - beds |
show details | |

|
#32
Lagente Cir
Venice, FL 34293
|
- sq. feet
|
- baths - beds |
show details | |

|
#33
E Venice Ave # 181
Venice, FL 34292
|
- sq. feet
|
- baths - beds |
show details | |

|
#34
Canyonland Way
Venice, FL 34293
|
- sq. feet
|
- baths - beds |
show details | |

|
#35
Blackfin St
Venice, FL 34292
|
- sq. feet
|
- baths - beds |
show details | |

|
#36
Lewis Rd
Venice, FL 34292
|
- sq. feet
|
- baths - beds |
show details | |

|
#37
Ibiza Loop
Venice, FL 34292
|
- sq. feet
|
- baths - beds |
show details | |

|
#38
Gertrude Ln
Venice, FL 34292
|
- sq. feet
|
- baths - beds |
show details | |

|
#39
W Venice Ave
Venice, FL 34285
|
- sq. feet
|
- baths - beds |
show details | |

|
#40
Jupiter Rd
Venice, FL 34293
|
- sq. feet
|
- baths - beds |
show details |
| Photo | Address | Area | Beds / Baths | Price | Details |
|---|---|---|---|---|---|

|
Check over 1 million property listings on Foreclosure.com!
|
browse all offers | |||
| Photo | Address | Area | Beds / Baths | Price | Details |
|---|


- 23,61887.3%White alone
- 1,3915.1%Two or more races
- 1,2644.7%Hispanic
- 5682.1%Asian alone
- 2010.7%Black alone
- 560.2%Other race alone
- 340.1%Native Hawaiian and Other
Pacific Islander alone - 180.07%American Indian alone
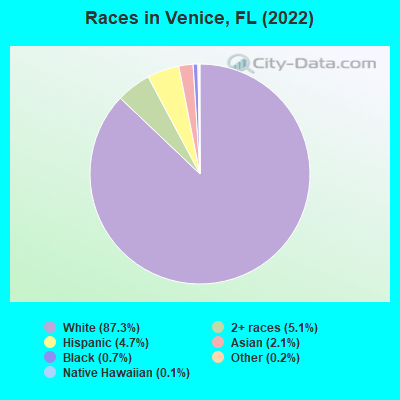
Races in Venice detailed stats: ancestries, foreign born residents, place of birth
According to our research of Florida and other state lists, there were 64 registered sex offenders living in Venice, Florida as of April 27, 2024.
The ratio of all residents to sex offenders in Venice is 352 to 1.
Type |
2009 |
2010 |
2011 |
2012 |
2013 |
2014 |
2015 |
2016 |
2017 |
2018 |
2019 |
2020 |
|---|---|---|---|---|---|---|---|---|---|---|---|---|
| Murders (per 100,000) | 0 (0.0) | 2 (9.6) | 0 (0.0) | 0 (0.0) | 0 (0.0) | 0 (0.0) | 0 (0.0) | 0 (0.0) | 0 (0.0) | 0 (0.0) | 1 (4.2) | 0 (0.0) |
| Rapes (per 100,000) | 11 (51.8) | 0 (0.0) | 3 (14.3) | 3 (14.2) | 3 (14.2) | 4 (18.7) | 4 (18.2) | 5 (22.2) | 4 (17.6) | 1 (4.3) | 1 (4.2) | 2 (8.2) |
| Robberies (per 100,000) | 4 (18.8) | 4 (19.3) | 9 (42.8) | 6 (28.3) | 4 (18.9) | 5 (23.4) | 3 (13.6) | 5 (22.2) | 1 (4.4) | 2 (8.6) | 3 (12.6) | 5 (20.5) |
| Assaults (per 100,000) | 32 (150.7) | 30 (144.6) | 16 (76.1) | 31 (146.4) | 30 (141.8) | 31 (145.0) | 28 (127.4) | 14 (62.2) | 23 (101.0) | 22 (94.2) | 15 (63.2) | 9 (36.9) |
| Burglaries (per 100,000) | 140 (659.3) | 87 (419.3) | 129 (613.4) | 99 (467.4) | 95 (449.2) | 74 (346.2) | 87 (395.8) | 65 (288.7) | 44 (193.3) | 38 (162.7) | 30 (126.4) | 56 (229.8) |
| Thefts (per 100,000) | 492 (2,317) | 466 (2,246) | 414 (1,969) | 308 (1,454) | 338 (1,598) | 311 (1,455) | 301 (1,369) | 293 (1,301) | 249 (1,094) | 269 (1,151) | 242 (1,020) | 274 (1,125) |
| Auto thefts (per 100,000) | 18 (84.8) | 14 (67.5) | 13 (61.8) | 11 (51.9) | 13 (61.5) | 11 (51.5) | 11 (50.0) | 16 (71.1) | 12 (52.7) | 16 (68.5) | 11 (46.4) | 16 (65.7) |
| Arson (per 100,000) | 1 (4.7) | 1 (4.8) | 1 (4.8) | 5 (23.6) | 1 (4.7) | 1 (4.7) | 0 (0.0) | 1 (4.4) | 5 (22.0) | 0 (0.0) | 0 (0.0) | 5 (20.5) |
| City-Data.com crime index | 222.8 | 178.6 | 166.1 | 144.1 | 145.7 | 137.5 | 130.6 | 114.8 | 97.1 | 87.7 | 81.6 | 86.4 |
The City-Data.com crime index weighs serious crimes and violent crimes more heavily. Higher means more crime, U.S. average is 246.1. It adjusts for the number of visitors and daily workers commuting into cities.
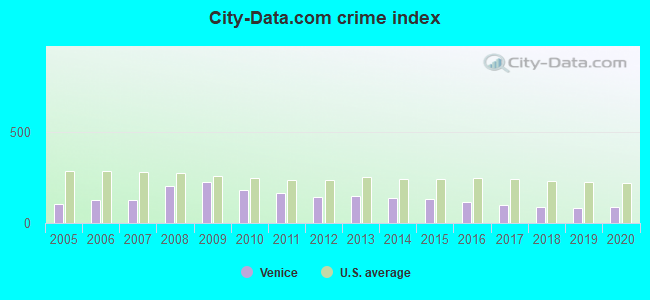
Crime rate in Venice detailed stats: murders, rapes, robberies, assaults, burglaries, thefts, arson
Full-time law enforcement employees in 2020, including police officers: 68 (50 officers - 46 male; 4 female).
| Officers per 1,000 residents here: | 2.05 |
| Florida average: | 2.26 |
 Recent articles from our blog. Our writers, many of them Ph.D. graduates or candidates, create easy-to-read articles on a wide variety of topics.


Latest news from Venice, FL collected exclusively by city-data.com from local newspapers, TV, and radio stations
Ancestries: American (18.1%), German (14.4%), Italian (11.9%), English (10.6%), Irish (8.5%), Polish (3.7%).
Current Local Time: EST time zone
Elevation: 15 feet
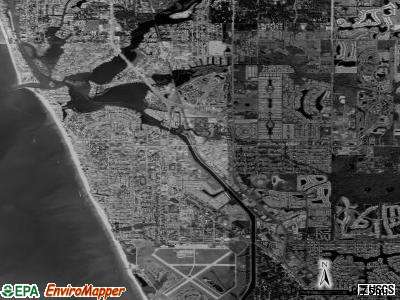
Land area: 9.12 square miles.
Population density: 2,992 people per square mile (average).
3,178 residents are foreign born (6.0% Europe, 2.1% Asia, 1.9% Latin America, 1.5% North America).
| This city: | 11.7% |
| Florida: | 21.1% |
Median real estate property taxes paid for housing units with mortgages in 2022: $3,560 (0.8%)
Median real estate property taxes paid for housing units with no mortgage in 2022: $3,101 (0.8%)
Nearest city with pop. 50,000+: Sarasota, FL  (17.5 miles , pop. 52,715).
Nearest city with pop. 200,000+: St. Petersburg, FL (49.3 miles , pop. 248,232).
Nearest city with pop. 1,000,000+: Houston, TX (808.1 miles , pop. 1,953,631).
Nearest cities:
), ), ), ), )Latitude: 27.10 N, Longitude: 82.44 W
Daytime population change due to commuting: +11,502 (+42.5%)
Workers who live and work in this city: 4,025 (53.8%)
Area code: 941
Property values in Venice, FL
Venice tourist attractions:
Venice, Florida accommodation & food services, waste management - Economy and Business Data
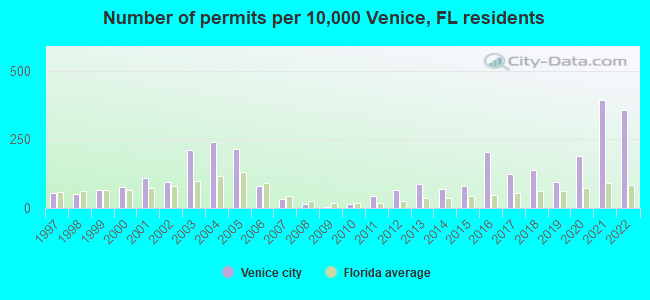
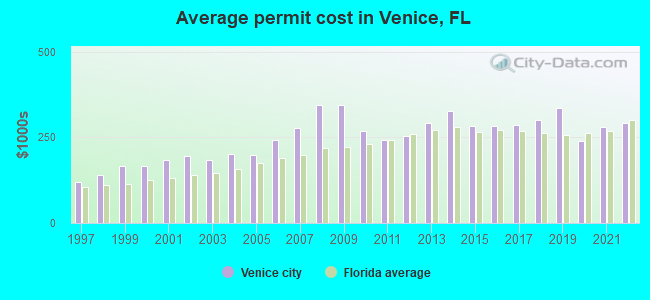
Single-family new house construction building permits:
- 2022: 632 buildings, average cost: $291,900
- 2021: 701 buildings, average cost: $280,700
- 2020: 340 buildings, average cost: $240,500
- 2019: 168 buildings, average cost: $336,400
- 2018: 245 buildings, average cost: $301,100
- 2017: 218 buildings, average cost: $285,800
- 2016: 366 buildings, average cost: $283,300
- 2015: 140 buildings, average cost: $283,300
- 2014: 125 buildings, average cost: $325,600
- 2013: 152 buildings, average cost: $292,400
- 2012: 116 buildings, average cost: $255,300
- 2011: 77 buildings, average cost: $244,100
- 2010: 26 buildings, average cost: $268,300
- 2009: 8 buildings, average cost: $345,800
- 2008: 28 buildings, average cost: $343,800
- 2007: 59 buildings, average cost: $277,600
- 2006: 140 buildings, average cost: $243,000
- 2005: 381 buildings, average cost: $199,700
- 2004: 426 buildings, average cost: $203,000
- 2003: 379 buildings, average cost: $184,200
- 2002: 167 buildings, average cost: $196,200
- 2001: 193 buildings, average cost: $184,600
- 2000: 135 buildings, average cost: $165,600
- 1999: 117 buildings, average cost: $167,600
- 1998: 92 buildings, average cost: $138,800
- 1997: 100 buildings, average cost: $119,700
| Here: | 4.1% |
| Florida: | 2.9% |
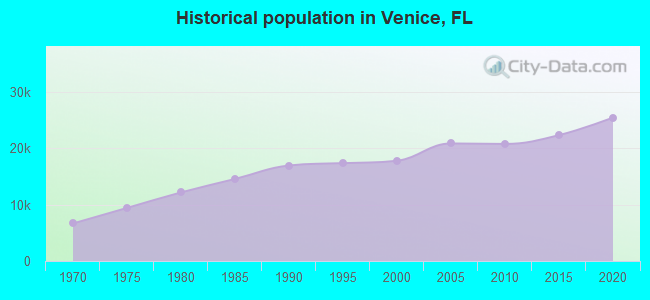
Population change in the 1990s: +146 (+0.8%).
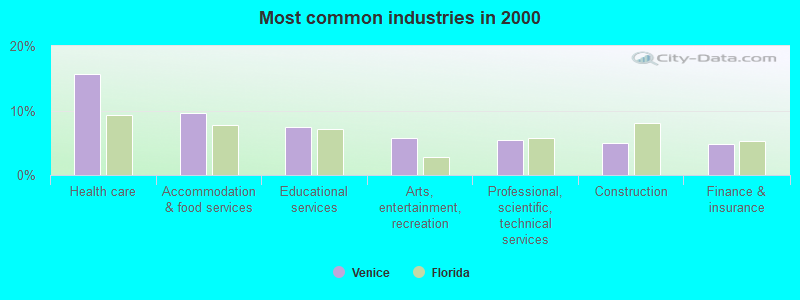
- Health care (15.6%)
- Accommodation & food services (9.6%)
- Educational services (7.5%)
- Arts, entertainment, recreation (5.8%)
- Professional, scientific, technical services (5.4%)
- Construction (4.9%)
- Finance & insurance (4.8%)
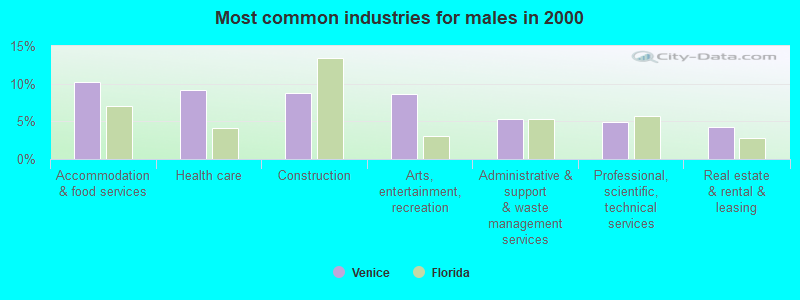
- Accommodation & food services (10.3%)
- Health care (9.2%)
- Construction (8.8%)
- Arts, entertainment, recreation (8.6%)
- Administrative & support & waste management services (5.4%)
- Professional, scientific, technical services (4.9%)
- Real estate & rental & leasing (4.2%)
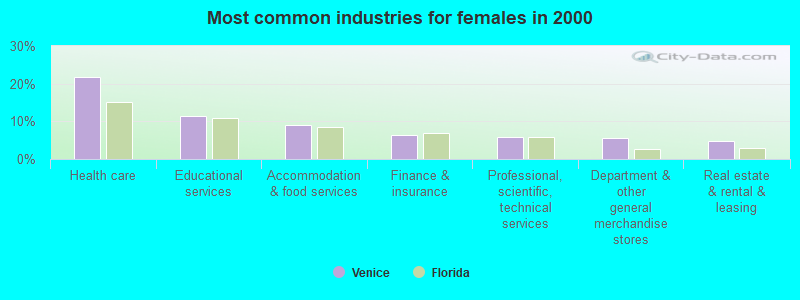
- Health care (21.7%)
- Educational services (11.4%)
- Accommodation & food services (9.0%)
- Finance & insurance (6.3%)
- Professional, scientific, technical services (6.0%)
- Department & other general merchandise stores (5.5%)
- Real estate & rental & leasing (4.9%)
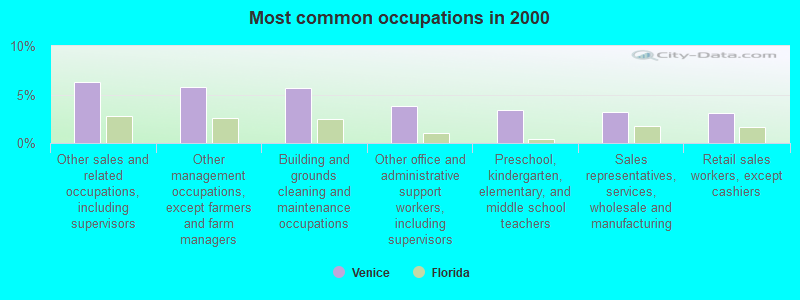
- Other sales and related occupations, including supervisors (6.2%)
- Other management occupations, except farmers and farm managers (5.8%)
- Building and grounds cleaning and maintenance occupations (5.6%)
- Other office and administrative support workers, including supervisors (3.8%)
- Preschool, kindergarten, elementary, and middle school teachers (3.4%)
- Sales representatives, services, wholesale and manufacturing (3.2%)
- Retail sales workers, except cashiers (3.1%)
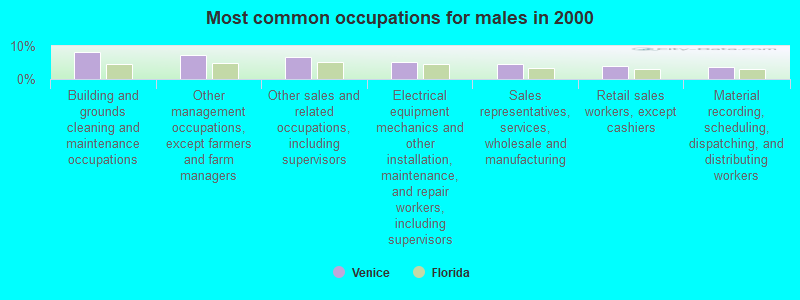
- Building and grounds cleaning and maintenance occupations (8.2%)
- Other management occupations, except farmers and farm managers (7.3%)
- Other sales and related occupations, including supervisors (6.5%)
- Electrical equipment mechanics and other installation, maintenance, and repair workers, including supervisors (5.0%)
- Sales representatives, services, wholesale and manufacturing (4.6%)
- Retail sales workers, except cashiers (3.9%)
- Material recording, scheduling, dispatching, and distributing workers (3.6%)
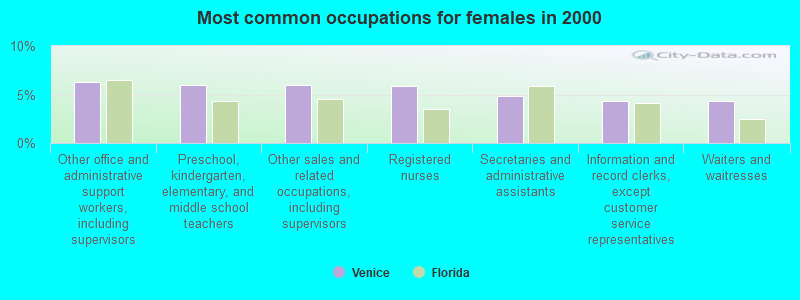
- Other office and administrative support workers, including supervisors (6.3%)
- Preschool, kindergarten, elementary, and middle school teachers (6.0%)
- Other sales and related occupations, including supervisors (6.0%)
- Registered nurses (5.9%)
- Secretaries and administrative assistants (4.9%)
- Information and record clerks, except customer service representatives (4.4%)
- Waiters and waitresses (4.3%)
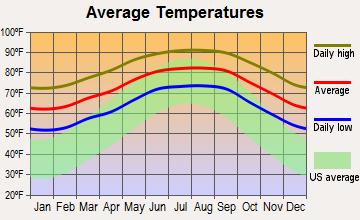
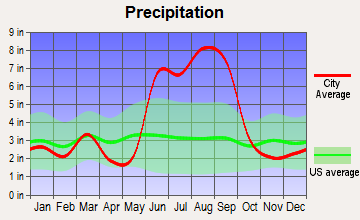
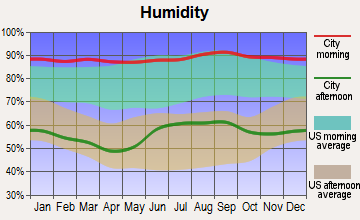
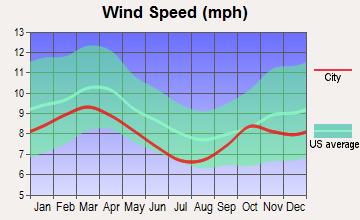
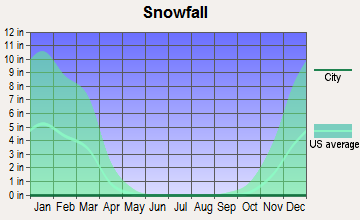
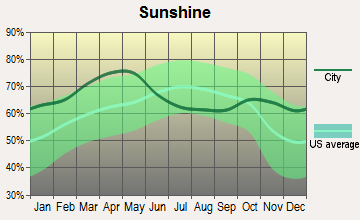
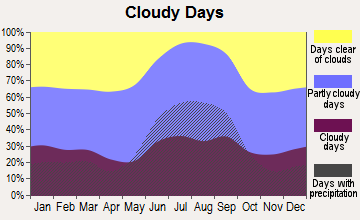
Average climate in Venice, Florida
Based on data reported by over 4,000 weather stations
|
|

(lower is better)
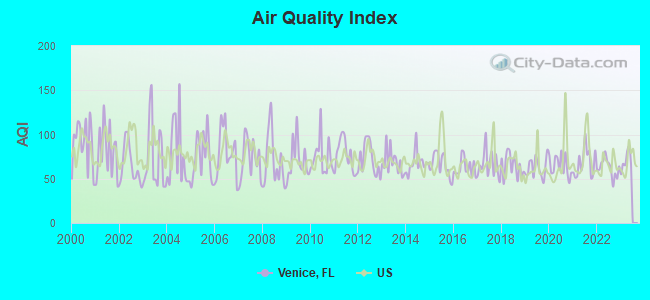
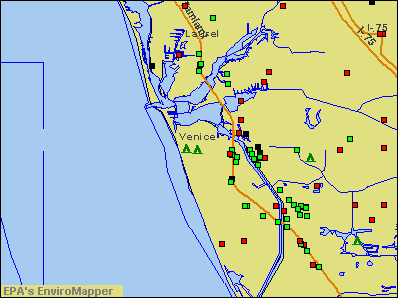
Air Quality Index (AQI) level in 2022 was 62.2. This is about average.
| City: | 62.2 |
| U.S.: | 72.6 |
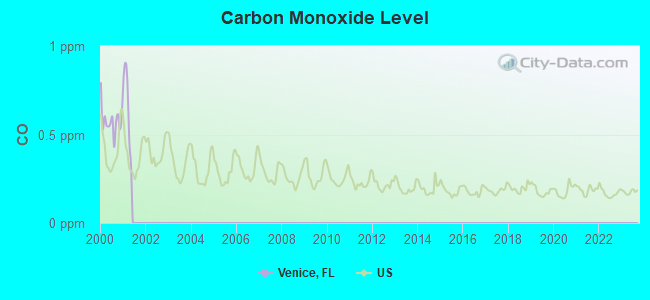
Carbon Monoxide (CO) [ppm] level in 2000 was 0.577. This is significantly worse than average. Closest monitor was 1.9 miles away from the city center.
| City: | 0.577 |
| U.S.: | 0.251 |
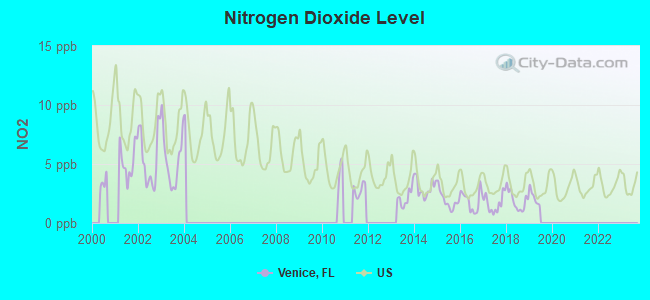
Nitrogen Dioxide (NO2) [ppb] level in 2018 was 1.88. This is significantly better than average. Closest monitor was 17.6 miles away from the city center.
| City: | 1.88 |
| U.S.: | 5.11 |
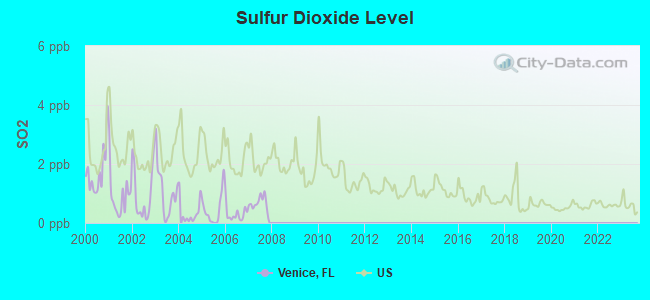
Sulfur Dioxide (SO2) [ppb] level in 2007 was 0.669. This is significantly better than average. Closest monitor was 12.4 miles away from the city center.
| City: | 0.669 |
| U.S.: | 1.515 |
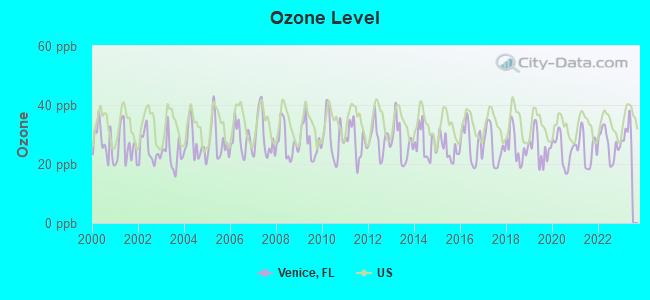
Ozone [ppb] level in 2022 was 26.7. This is better than average. Closest monitor was 4.8 miles away from the city center.
| City: | 26.7 |
| U.S.: | 33.3 |
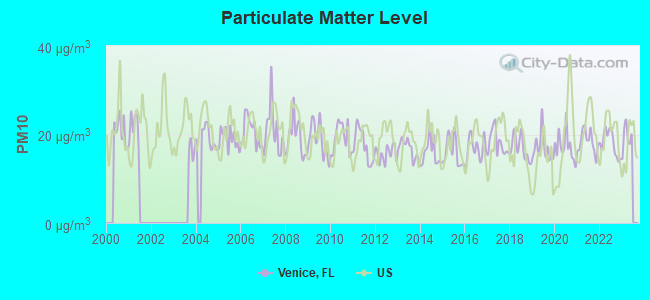
Particulate Matter (PM10) [µg/m3] level in 2022 was 18.1. This is about average. Closest monitor was 13.9 miles away from the city center.
| City: | 18.1 |
| U.S.: | 19.2 |
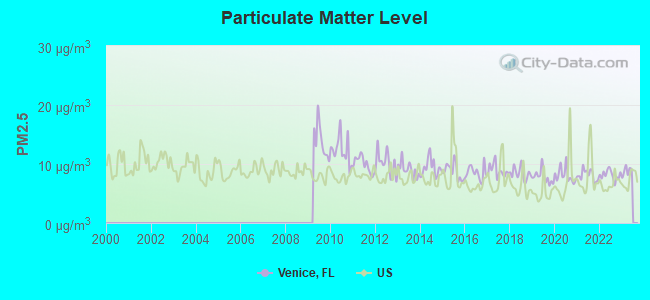
Particulate Matter (PM2.5) [µg/m3] level in 2022 was 8.14. This is about average. Closest monitor was 13.9 miles away from the city center.
| City: | 8.14 |
| U.S.: | 8.11 |
Tornado activity:
Venice-area historical tornado activity is near Florida state average. It is 9% greater than the overall U.S. average.
On 10/31/1958, a category F3 (max. wind speeds 158-206 mph) tornado 30.4 miles away from the Venice city center injured 4 people and caused between $5000 and $50,000 in damages.
On 11/9/1968, a category F2 (max. wind speeds 113-157 mph) tornado 0.7 miles away from the city center injured 2 people and caused between $50,000 and $500,000 in damages.
Earthquake activity:
Venice-area historical earthquake activity is significantly above Florida state average. It is 91% smaller than the overall U.S. average.On 9/10/2006 at 14:56:08, a magnitude 5.9 (5.9 MB, 5.5 MS, 5.8 MW, Class: Moderate, Intensity: VI - VII) earthquake occurred 265.6 miles away from the city center
On 3/31/1992 at 14:59:39, a magnitude 3.8 (3.8 MB, Depth: 3.1 mi, Class: Light, Intensity: II - III) earthquake occurred 216.9 miles away from the city center
On 10/24/1997 at 08:35:17, a magnitude 4.9 (4.8 MB, 4.2 MS, 4.9 LG, Depth: 6.2 mi, Class: Light, Intensity: IV - V) earthquake occurred 403.4 miles away from Venice center
On 4/18/1997 at 14:57:35, a magnitude 3.9 (3.9 MB, Depth: 20.5 mi) earthquake occurred 270.5 miles away from Venice center
On 5/6/2018 at 16:47:09, a magnitude 4.6 (4.6 MB, Depth: 6.2 mi) earthquake occurred 386.5 miles away from the city center
On 6/23/2016 at 17:20:29, a magnitude 3.8 (3.8 ML) earthquake occurred 270.4 miles away from Venice center
Magnitude types: regional Lg-wave magnitude (LG), body-wave magnitude (MB), local magnitude (ML), surface-wave magnitude (MS), moment magnitude (MW)
Natural disasters:
The number of natural disasters in Sarasota County (27) is a lot greater than the US average (15).Major Disasters (Presidential) Declared: 17
Emergencies Declared: 5
Causes of natural disasters: Hurricanes: 10, Tropical Storms: 6, Fires: 5, Floods: 5, Storms: 4, Tornadoes: 2, Freeze: 1, Wind: 1, Other: 1 (Note: some incidents may be assigned to more than one category).
Hospitals in Venice:
Nursing Homes in Venice:
- HARBORCHASE OF VENICE (950 PINEBROOK ROAD)
- HERITAGE HEALTH CARE CENTER (1026 ALBEE FARM RD)
- MANORCARE HEALTH SERVICES (1450 EAST VENICE AVENUE)
- PINEBROOK CARE AND REHABILITATION CENTER (1240 PINEBROOK ROAD)
- SOUTHWEST FLORIDA HEALTH CARE CENTER (950 S TAMIAMI TRAIL)
- SUNSET LAKE HEALTH AND REHABILITATION CENTER (832 SUNSET LAKE BOULEVARD)
- VENICE NURSING AND REHAB CENTER (200 FIELD AVE SOUTH)
- VENICE REHAB AND HEALTH CENTER (437 S NOKOMIS AVE)
- VILLAGE ON THE ISLE (910 TAMIAMI TRAIL SOUTH)
Dialysis Facilities in Venice:
Home Health Centers in Venice:
Airports located in Venice:
- Venice Municipal Airport (VNC) (Runways: 2, Itinerant Ops: 28,816, Local Ops: 32,018)
Colleges/universities with over 2000 students nearest to Venice:
- State College of Florida-Manatee-Sarasota (about 26 miles; Bradenton, FL; Full-time enrollment: 8,012)
- Eckerd College (about 46 miles; Saint Petersburg, FL; FT enrollment: 2,437)
- University of South Florida-St Petersburg (about 48 miles; St. Petersburg, FL; FT enrollment: 4,459)
- Edison State College (about 51 miles; Fort Myers, FL; FT enrollment: 10,649)
- Hillsborough Community College (about 58 miles; Tampa, FL; FT enrollment: 19,838)
- St Petersburg College (about 59 miles; Clearwater, FL; FT enrollment: 21,467)
- The University of Tampa (about 59 miles; Tampa, FL; FT enrollment: 7,216)
Public high schools in Venice:
- VENICE SENIOR HIGH SCHOOL (Students: 979, Location: 1 INDIAN AVE, Grades: 9-12)
- ISLAND VILLAGE MONTESSORI SCHOOL (Students: 144, Location: 2001 PINEBROOK RD, Grades: KG-9, Charter school)
- SKY ACADEMY (Location: 701 CENTER RD, Grades: 6-9, Charter school)
Private high schools in Venice:
Public elementary/middle schools in Venice:
- TAYLOR RANCH ELEMENTARY SCHOOL (Students: 1,509, Location: 2500 TAYLOR RANCH TRL, Grades: PK-5)
- VENICE MIDDLE SCHOOL (Students: 761, Location: 1900 CENTER RD, Grades: 6-8)
- STUDENT LEADERSHIP ACADEMY (Students: 332, Location: 200 FIELD AVE E, Grades: 6-8, Charter school)
- VENICE ELEMENTARY SCHOOL (Students: 317, Location: 150 MIAMI AVE E, Grades: PK-5)
- GARDEN ELEMENTARY SCHOOL (Students: 309, Location: 700 CENTER RD, Grades: PK-5)
Private elementary/middle school in Venice:
User-submitted facts and corrections:
- Sarasota Sharks Swim Team Training Facility: Venice YMCA
- The official City web site is venicegov.com Also the hospital in town changed from Bons Secor to Venice Regional Medical Center.
Points of interest:
Notable locations in Venice: Bay Plaza at Bird Bay Village (A), City of Venice Fire Department Station 51 (B), City of Venice Fire Department Station 52 (C), Sarasota County Rescue Station 52 (D), Sarasota County Rescue Station 51 (E), Venice Police Department (F), Sarasota County Sheriff's Office South County Jail (G). Display/hide their locations on the map
Churches in Venice include: Saint Marks Church (A), Union Church (B). Display/hide their locations on the map
Lake: Red Lake (A). Display/hide its location on the map
Creek: Curry Creek (A). Display/hide its location on the map
Tourist attractions: Continuing Care- Inc. dba Natura (Recreation Areas; 1662 Quail Lake Drive), Dominican Republic Travel Guide (c/o 201 South US41 By-Pass ), Affordable Travel (919 Tanager Road).
Hotels: Affordable Travel (919 Tanager Road), Best Western Sandbar Beach Resort (811 The Esplanade North), Best Western Ambassador Suites (400 Commercial Court), Venice Beach Resort (501 Venice Ave W), Backstage Lounge Holiday Inn (455 US Highway 41 Bypass North), Beachcomber in Venice FL (720 Golden Beach Blvd.).
Courts: Florida State - Judicial- State Attorney (4000 Tamiami Trail South), Sarasota County - Teen Court (101 South Washington), Sarasota County - Human Resources Clerk Of The Circuit Court And Co C (941 861 Rjob), Sarasota County - Court Reporter Judicial Cntr (Judicial Centre), Sarasota County - Clerk of the Circuit Court & County Comptroller- Personnel Human Resou (2001 Adams Lane).
Drinking water stations with addresses in Venice and their reported violations in the past:
FLORIDA PINES MOBILE HOME PARK (Population served: 280, Groundwater):Past monitoring violations:SUNCOAST CATHEDRAL (Population served: 95, Groundwater):
- Failure to Conduct Assessment Monitoring - In APR-2014, Contaminant: E. COLI
- Monitoring and Reporting (DBP) - Between JAN-2006 and MAR-2006, Contaminant: TTHM. Follow-up actions: St Violation/Reminder Notice (APR-24-2006)
- 2 routine major monitoring violations
Past health violations:SALT LIFE ENTERPRISES (Population served: 50, Groundwater):Past monitoring violations:
- MCL, Monthly (TCR) - In NOV-2005, Contaminant: Coliform
- One routine major monitoring violation
- One regular monitoring violation
Past monitoring violations:BARN SWALLOW APARTMENTS (Serves MI, Population served: 50, Groundwater):
- One routine major monitoring violation
- One regular monitoring violation
Past health violations:MYAKKA RIVER TRAILS (Population served: 50, Groundwater):Past monitoring violations:
- MCL, Average - Between JAN-2011 and MAR-2011, Contaminant: Nitrate. Follow-up actions: St Public Notif received (JAN-26-2011), St Violation/Reminder Notice (JAN-26-2011), St Public Notif requested (JAN-26-2011), St Compliance achieved (MAY-08-2011), St Public Notif received (2 times from SEP-12-2011 to OCT-19-2011)
- MCL, Monthly (TCR) - In JUN-2007, Contaminant: Coliform. Follow-up actions: St Public Notif received (JUN-09-2007), St Violation/Reminder Notice (JUN-14-2007), St Compliance achieved (JUN-14-2007), St Boil Water Order (JUN-14-2007), St Public Notif received (JUL-11-2007), St Boil Water Order (JUL-24-2007)
- MCL, Monthly (TCR) - In MAY-2007, Contaminant: Coliform. Follow-up actions: St Public Notif received (MAY-07-2007), St Boil Water Order (MAY-11-2007), St Public Notif requested (MAY-14-2007), St Violation/Reminder Notice (MAY-14-2007), St Compliance achieved (JUN-30-2007)
- Monitoring, Repeat Major (TCR) - In JUN-2007, Contaminant: Coliform (TCR). Follow-up actions: St Compliance achieved (JUL-02-2007), St Violation/Reminder Notice (JUL-16-2007), St Public Notif requested (JUL-16-2007)
- 2 routine major monitoring violations
Past monitoring violations:SHOPRITE MOWERS (Population served: 35, Groundwater):
- Failure to Conduct Assessment Monitoring - Between OCT-2013 and DEC-2013, Contaminant: E. COLI. Follow-up actions: St Violation/Reminder Notice (JAN-28-2014), St AO (w/o penalty) issued (MAR-21-2014), St Public Notif requested (APR-16-2014), St Public Notif received (APR-17-2014)
- 2 routine major monitoring violations
- One minor monitoring violation
Past monitoring violations:QUIK MART (Population served: 25, Groundwater):
- One regular monitoring violation
Past monitoring violations:MEADOWS TRAILER PARK (Population served: 25, Groundwater):
- 2 routine major monitoring violations
- One minor monitoring violation
- One regular monitoring violation
Past monitoring violations:
- One routine major monitoring violation
Drinking water stations with addresses in Venice that have no violations reported:
- STOP ; SHOP CONVEINENCE STORE (Population served: 150, Primary Water Source Type: Groundwater)
- UNITY CHURCH ON THE GULF (Population served: 125, Primary Water Source Type: Groundwater)
- VENICE BIBLE CHURCH (Population served: 100, Primary Water Source Type: Groundwater)
- HAZELTINE NURSERIES (Population served: 60, Primary Water Source Type: Groundwater)
- LACKEY DENTAL OFFICE (Population served: 25, Primary Water Source Type: Groundwater)
| This city: | 1.7 people |
| Florida: | 2.5 people |
| This city: | 54.3% |
| Whole state: | 65.2% |
| This city: | 3.9% |
| Whole state: | 7.3% |
Likely homosexual households (counted as self-reported same-sex unmarried-partner households)
- Lesbian couples: 0.3% of all households
- Gay men: 0.3% of all households
People in group quarters in Venice in 2010:
- 549 people in nursing facilities/skilled-nursing facilities
- 24 people in emergency and transitional shelters (with sleeping facilities) for people experiencing homelessness
- 4 people in group homes intended for adults
- 4 people in workers' group living quarters and job corps centers
8 people in other group homes in 2000
Banks with most branches in Venice (2011 data):
- Wells Fargo Bank, National Association: Venetian Gateway Branch, South Venice Branch, Venice Branch, Venice Downtown Branch. Info updated 2011/04/05: Bank assets: $1,161,490.0 mil, Deposits: $905,653.0 mil, headquarters in Sioux Falls, SD, positive income, 6395 total offices, Holding Company: Wells Fargo & Company
- SunTrust Bank: Downtown Venice Branch, Village Branch, Downtown Venice Drive-In, Southbridge Branch. Info updated 2010/05/27: Bank assets: $171,291.7 mil, Deposits: $129,833.2 mil, headquarters in Atlanta, GA, positive income, Commercial Lending Specialization, 1716 total offices, Holding Company: Suntrust Banks, Inc.
- JPMorgan Chase Bank, National Association: Venice Branch, Venice - Bird Bay, Us 41 And Jacaranda Blvd Branch, Aston Gardens Banking Center Branch. Info updated 2011/11/10: Bank assets: $1,811,678.0 mil, Deposits: $1,190,738.0 mil, headquarters in Columbus, OH, positive income, International Specialization, 5577 total offices, Holding Company: Jpmorgan Chase & Co.
- Capital Bank, National Association: The Island Branch, Auburn Branch, Messenger Service Branch, East Venice Avenue Branch. Info updated 2011/09/21: Bank assets: $6,448.0 mil, Deposits: $5,135.4 mil, headquarters in Miami, FL, positive income, Commercial Lending Specialization, 152 total offices, Holding Company: North American Financial Holdings, Inc.
- Fifth Third Bank: Jacaranda Office, Venice Branch, Downtown Venice Branch. Info updated 2009/10/05: Bank assets: $114,540.4 mil, Deposits: $89,689.1 mil, headquarters in Cincinnati, OH, positive income, Commercial Lending Specialization, 1378 total offices, Holding Company: Fifth Third Bancorp
- Branch Banking and Trust Company: Venice Branch, Venice Bypass Branch, Jacaranda Branch. Info updated 2010/03/29: Bank assets: $168,867.6 mil, Deposits: $127,549.5 mil, headquarters in Winston Salem, NC, positive income, Commercial Lending Specialization, 1793 total offices, Holding Company: Bb&T Corporation
- Bank of America, National Association: South Venice Branch, Venice Pines Branch, Venice Branch. Info updated 2009/11/18: Bank assets: $1,451,969.3 mil, Deposits: $1,077,176.8 mil, headquarters in Charlotte, NC, positive income, 5782 total offices, Holding Company: Bank Of America Corporation
- Regions Bank: South Venice Branch at 2090 Tamiami Trail South, branch established on 2002/09/03; North Venice Branch at 1425 East Venice Avenue, branch established on 2001/06/04. Info updated 2011/02/24: Bank assets: $123,368.2 mil, Deposits: $98,301.3 mil, headquarters in Birmingham, AL, positive income, Commercial Lending Specialization, 1778 total offices, Holding Company: Regions Financial Corporation
- Liberty Savings Bank, F.S.B.: 1679 South Tamiami Trail Branch at 1679 South Tamiami Trail, branch established on 1997/12/08; 4103 South Tamiami Trail Branch at 4103 South Tamiami Trail, branch established on 1998/02/12. Info updated 2011/07/21: Bank assets: $683.0 mil, Deposits: $553.2 mil, headquarters in Wilmington, OH, positive income, Mortgage Lending Specialization, 33 total offices
- 10 other banks with 10 local branches
For population 15 years and over in Venice:
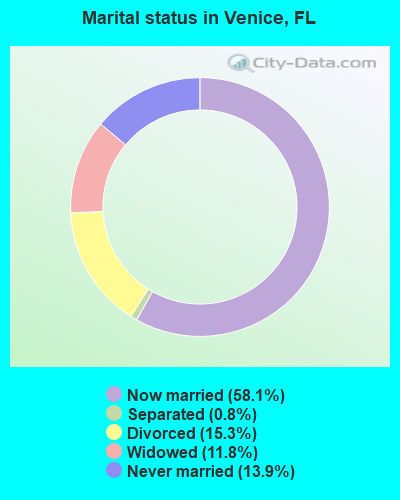
- Never married: 13.9%
- Now married: 58.1%
- Separated: 0.8%
- Widowed: 11.8%
- Divorced: 15.3%
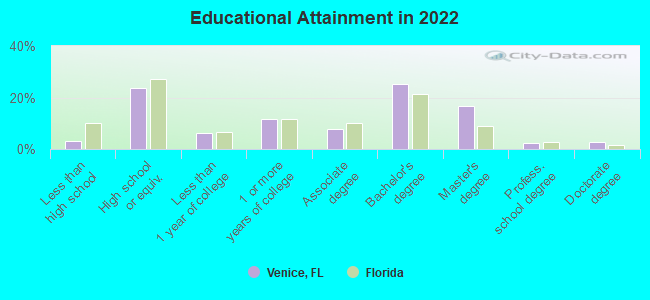
For population 25 years and over in Venice:
- High school or higher: 96.5%
- Bachelor's degree or higher: 44.6%
- Graduate or professional degree: 20.6%
- Unemployed: 2.2%
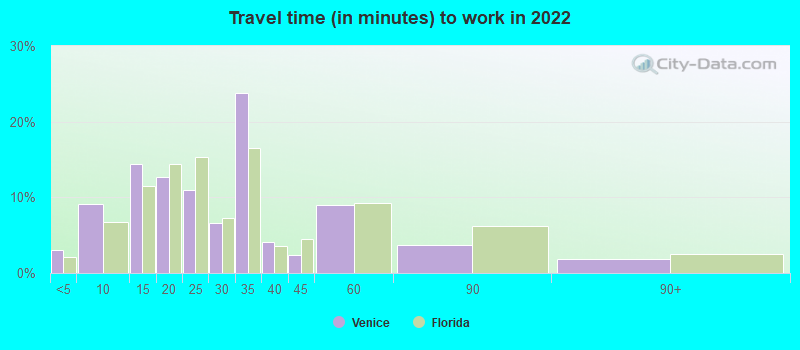
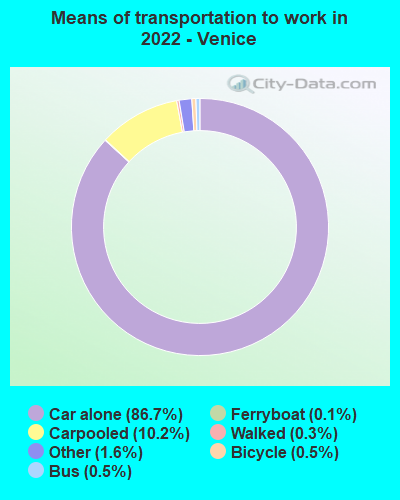
- Mean travel time to work (commute): 17.7 minutes
| Here: | 10.3 |
| Florida average: | 12.2 |
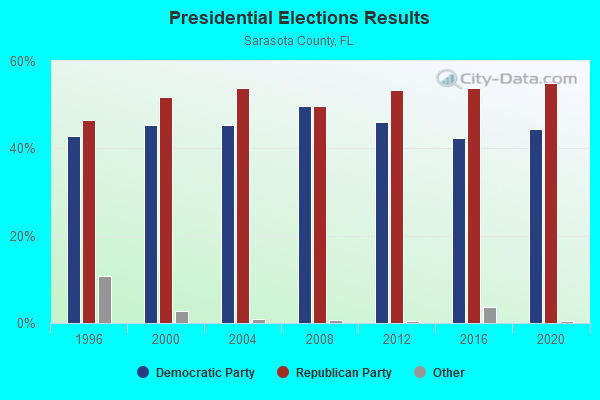
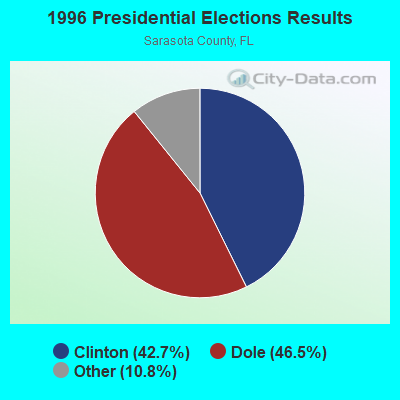
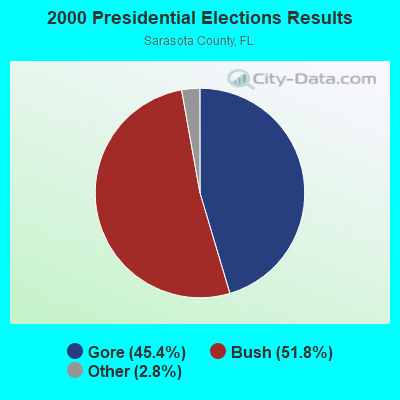
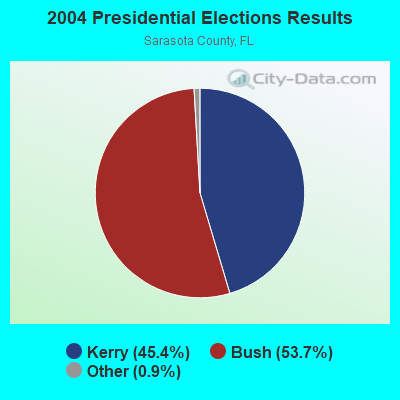
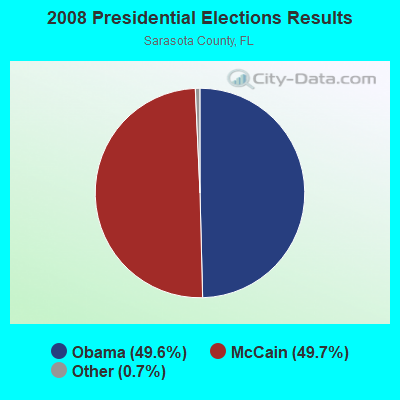
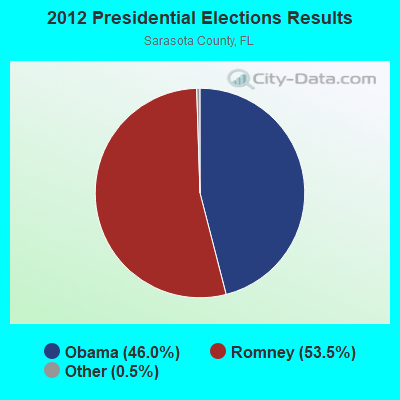
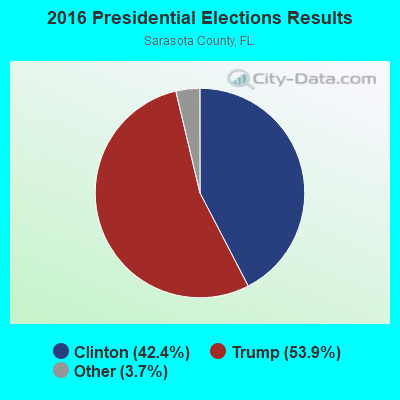
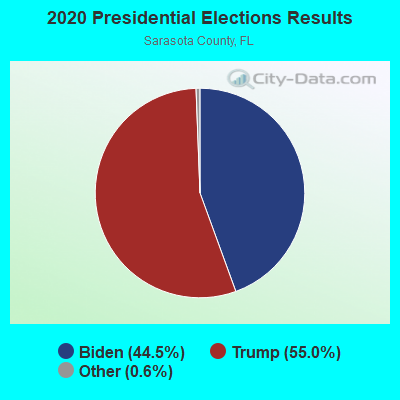
Graphs represent county-level data. Detailed 2008 Election Results
Religion statistics for Venice, FL (based on Sarasota County data)
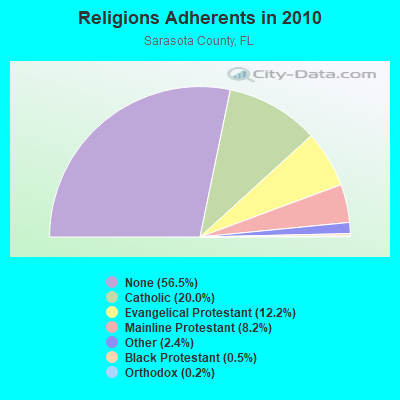
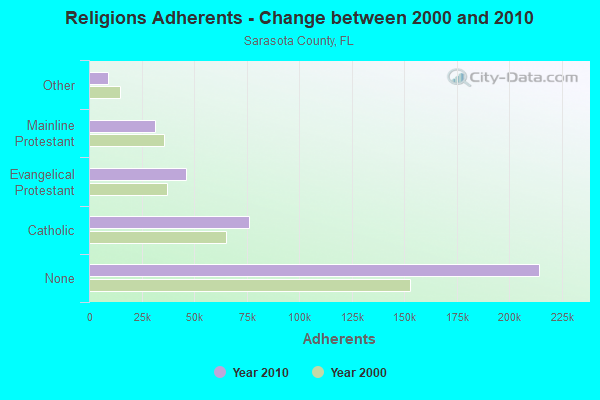
| Religion | Adherents | Congregations |
|---|---|---|
| Catholic | 76,000 | 13 |
| Evangelical Protestant | 46,290 | 174 |
| Mainline Protestant | 31,191 | 58 |
| Other | 9,089 | 38 |
| Black Protestant | 1,901 | 7 |
| Orthodox | 620 | 2 |
| None | 214,357 | - |
Food Environment Statistics:
| This county: | 1.81 / 10,000 pop. |
| State: | 2.04 / 10,000 pop. |
| Sarasota County: | 0.08 / 10,000 pop. |
| State: | 0.11 / 10,000 pop. |
| This county: | 1.27 / 10,000 pop. |
| State: | 1.28 / 10,000 pop. |
| This county: | 2.26 / 10,000 pop. |
| Florida: | 3.04 / 10,000 pop. |
| This county: | 9.87 / 10,000 pop. |
| Florida: | 7.45 / 10,000 pop. |
| This county: | 9.1% |
| Florida: | 9.2% |
| This county: | 20.1% |
| Florida: | 23.7% |
| This county: | 12.4% |
| Florida: | 14.0% |
Health and Nutrition:
| This city: | 58.2% |
| Florida: | 51.4% |
| Here: | 53.6% |
| State: | 49.4% |
| Venice: | 28.3 |
| Florida: | 28.6 |
| Venice: | 15.4% |
| Florida: | 19.5% |
| Venice: | 11.9% |
| Florida: | 10.7% |
| Venice: | 7.2 |
| Florida: | 6.9 |
| Venice: | 36.8% |
| Florida: | 34.7% |
| Here: | 58.3% |
| Florida: | 57.0% |
| Venice: | 71.6% |
| Florida: | 79.2% |
More about Health and Nutrition of Venice, FL Residents
| Local government employment and payroll (March 2022) | |||||
| Function | Full-time employees | Monthly full-time payroll | Average yearly full-time wage | Part-time employees | Monthly part-time payroll |
|---|---|---|---|---|---|
| Firefighters | 66 | $389,291 | $70,780 | 0 | $0 |
| Other Government Administration | 51 | $283,442 | $66,692 | 0 | $0 |
| Water Supply | 49 | $235,071 | $57,568 | 0 | $0 |
| Police Protection - Officers | 46 | $320,673 | $83,654 | 0 | $0 |
| Solid Waste Management | 28 | $110,991 | $47,568 | 0 | $0 |
| Police - Other | 17 | $76,284 | $53,848 | 0 | $0 |
| Sewerage | 17 | $93,527 | $66,019 | 0 | $0 |
| Parks and Recreation | 17 | $65,479 | $46,220 | 0 | $0 |
| Financial Administration | 17 | $105,588 | $74,533 | 0 | $0 |
| Streets and Highways | 15 | $67,790 | $54,232 | 0 | $0 |
| Airports | 8 | $41,323 | $61,985 | 0 | $0 |
| Natural Resources | 7 | $43,779 | $75,050 | 0 | $0 |
| Other and Unallocable | 5 | $30,619 | $73,486 | 0 | $0 |
| Fire - Other | 3 | $14,107 | $56,428 | 0 | $0 |
| Totals for Government | 346 | $1,877,965 | $65,132 | 0 | $0 |
Venice government finances - Expenditure in 2018 (per resident):
- Current Operations - Police Protection: $8,688,000 ($318.57)
Local Fire Protection: $7,673,000 ($281.35)
Solid Waste Management: $5,233,000 ($191.88)
Water Utilities: $5,143,000 ($188.58)
Sewerage: $5,143,000 ($188.58)
General - Other: $3,205,000 ($117.52)
Financial Administration: $3,032,000 ($111.18)
Air Transportation: $2,464,000 ($90.35)
Central Staff Services: $2,447,000 ($89.73)
Natural Resources - Other: $1,925,000 ($70.59)
Parks and Recreation: $1,715,000 ($62.89)
Protective Inspection and Regulation - Other: $1,396,000 ($51.19)
Judicial and Legal Services: $394,000 ($14.45)
Regular Highways: $8,000 ($0.29)
- General - Interest on Debt: $134,000 ($4.91)
- Other Capital Outlay - Sewerage: $5,753,000 ($210.95)
Police Protection: $2,360,000 ($86.54)
Parks and Recreation: $1,542,000 ($56.54)
Regular Highways: $890,000 ($32.63)
Air Transportation: $743,000 ($27.24)
Natural Resources - Other: $181,000 ($6.64)
General - Other: $123,000 ($4.51)
Financial Administration: $86,000 ($3.15)
Local Fire Protection: $78,000 ($2.86)
- Water Utilities - Interest on Debt: $1,362,000 ($49.94)
Venice government finances - Revenue in 2018 (per resident):
- Charges - Sewerage: $11,001,000 ($403.38)
Solid Waste Management: $5,637,000 ($206.70)
Natural Resources - Other: $1,498,000 ($54.93)
Other: $189,000 ($6.93)
- Federal Intergovernmental - Other: $349,000 ($12.80)
Highways: $12,000 ($0.44)
- Local Intergovernmental - Other: $233,000 ($8.54)
Highways: $19,000 ($0.70)
General Local Government Support: $18,000 ($0.66)
- Miscellaneous - General Revenue - Other: $3,305,000 ($121.19)
Rents: $2,646,000 ($97.02)
Interest Earnings: $477,000 ($17.49)
Donations From Private Sources: $249,000 ($9.13)
Sale of Property: $150,000 ($5.50)
Fines and Forfeits: $28,000 ($1.03)
- Revenue - Water Utilities: $11,001,000 ($403.38)
- State Intergovernmental - General Local Government Support: $2,736,000 ($100.32)
Other: $1,308,000 ($47.96)
Highways: $161,000 ($5.90)
- Tax - Property: $12,874,000 ($472.06)
Public Utilities Sales: $3,783,000 ($138.71)
Other License: $3,364,000 ($123.35)
General Sales and Gross Receipts: $3,138,000 ($115.06)
Occupation and Business License - Other: $2,393,000 ($87.75)
Motor Fuels Sales: $1,026,000 ($37.62)
Insurance Premiums Sales: $408,000 ($14.96)
Venice government finances - Debt in 2018 (per resident):
- Long Term Debt - Outstanding Unspecified Public Purpose: $75,799,000 ($2779.37)
Beginning Outstanding - Unspecified Public Purpose: $43,098,000 ($1580.30)
Issue, Unspecified Public Purpose: $33,996,000 ($1246.55)
Retired Unspecified Public Purpose: $2,825,000 ($103.59)
Venice government finances - Cash and Securities in 2018 (per resident):
- Bond Funds - Cash and Securities: $3,931,000 ($144.14)
- Other Funds - Cash and Securities: $112,618,000 ($4129.44)
- Sinking Funds - Cash and Securities: $257,000 ($9.42)
11.25% of this county's 2021 resident taxpayers lived in other counties in 2020 ($164,585 average adjusted gross income)
| Here: | 11.25% |
| Florida average: | 8.80% |
0.02% of residents moved from foreign countries ($156 average AGI)
Sarasota County: 0.02% Florida average: 0.05%
Top counties from which taxpayers relocated into this county between 2020 and 2021:
| from Manatee County, FL | |
| from Charlotte County, FL | |
| from Hillsborough County, FL |
7.51% of this county's 2020 resident taxpayers moved to other counties in 2021 ($100,435 average adjusted gross income)
| Here: | 7.51% |
| Florida average: | 7.45% |
0.02% of residents moved to foreign countries ($122 average AGI)
Sarasota County: 0.02% Florida average: 0.04%
Top counties to which taxpayers relocated from this county between 2020 and 2021:
| to Manatee County, FL | |
| to Charlotte County, FL | |
| to Hillsborough County, FL |
| Businesses in Venice, FL | ||||
| Name | Count | Name | Count | |
|---|---|---|---|---|
| 7-Eleven | 2 | Lowe's | 1 | |
| AMF Bowling | 1 | Marriott | 1 | |
| AT&T | 2 | MasterBrand Cabinets | 6 | |
| Ace Hardware | 1 | McDonald's | 4 | |
| Advance Auto Parts | 2 | Motel 6 | 1 | |
| Albertsons | 1 | Nissan | 1 | |
| Applebee's | 1 | Office Depot | 1 | |
| Arby's | 1 | Outback | 1 | |
| AutoZone | 1 | Outback Steakhouse | 1 | |
| Baskin-Robbins | 1 | Panda Express | 1 | |
| Best Western | 1 | Panera Bread | 1 | |
| Blockbuster | 1 | Papa John's Pizza | 1 | |
| Budget Car Rental | 1 | Penske | 1 | |
| Burger King | 1 | Pier 1 Imports | 1 | |
| CVS | 4 | Pizza Hut | 2 | |
| Chevrolet | 1 | Publix Super Markets | 4 | |
| Circle K | 3 | Quiznos | 1 | |
| Cracker Barrel | 1 | RadioShack | 2 | |
| DHL | 2 | Sears | 1 | |
| Dairy Queen | 1 | Sprint Nextel | 1 | |
| Decora Cabinetry | 2 | Staples | 1 | |
| Dennys | 1 | Starbucks | 2 | |
| Domino's Pizza | 2 | Subway | 5 | |
| Dunkin Donuts | 1 | T-Mobile | 2 | |
| FedEx | 15 | T.J.Maxx | 1 | |
| Firestone Complete Auto Care | 1 | Taco Bell | 1 | |
| GNC | 2 | Target | 1 | |
| H&R Block | 2 | The Room Place | 1 | |
| Hilton | 1 | Tire Kingdom | 1 | |
| Holiday Inn | 1 | Toyota | 1 | |
| Home Depot | 1 | U-Haul | 2 | |
| Honda | 1 | UPS | 21 | |
| IHOP | 1 | Verizon Wireless | 1 | |
| Jones New York | 2 | Walgreens | 2 | |
| KFC | 1 | Walmart | 1 | |
| La-Z-Boy | 1 | YMCA | 1 | |
| Lane Furniture | 1 | |||
Strongest AM radio stations in Venice:
- WAMR (1320 AM; 5 kW; VENICE, FL; Owner: CITICASTERS LICENSES, L.P.)
- WMGG (820 AM; 50 kW; LARGO, FL; Owner: MEGA COMMUNICATIONS OF ST. PETERSBURG LICENSEE)
- WLSS (930 AM; 5 kW; SARASOTA, FL; Owner: WGUL-FM, INC.)
- WIBQ (1220 AM; 5 kW; SARASOTA, FL; Owner: NOVA BROADCASTING COMPANY)
- WQYK (1010 AM; 50 kW; SEFFNER, FL; Owner: INFINITY BROADCASTING CORPORATION OF TAMPA)
- WFLF (540 AM; 50 kW; PINE HILLS, FL; Owner: CLEAR CHANNEL BROADCASTING LICENSES, INC.)
- WWCN (770 AM; 10 kW; NORTH FORT MYERS, FL; Owner: WJPT LICENSE LIMITED PARTNERSHIP)
- WPTK (1200 AM; 10 kW; PINE ISLAND CENTER, FL; Owner: FORT MYERS BROADCASTING COMPANY)
- WFLA (970 AM; 25 kW; TAMPA, FL; Owner: CITICASTERS LICENSES, L.P.)
- WQTM (740 AM; 50 kW; ORLANDO, FL; Owner: CLEAR CHANNEL BROADCASTING LICENSES, INC.)
- WENG (1530 AM; daytime; 1 kW; ENGLEWOOD, FL)
- WHNZ (1250 AM; 25 kW; TAMPA, FL; Owner: CITICASTERS LICENSES, L.P.)
- WJNA (640 AM; 38 kW; ROYAL PALM BEACH, FL; Owner: SOUTH FLORIDA RADIO, INC.)
Strongest FM radio stations in Venice:
- WDDV (92.1 FM; VENICE, FL; Owner: CITICASTERS LICENSES, L.P.)
- WJIS (88.1 FM; BRADENTON, FL; Owner: RADIO TRAINING NETWORK, INC.)
- WSMR (89.1 FM; SARASOTA, FL; Owner: NORTHWESTERN COLLEGE)
- WTZB (105.9 FM; ENGLEWOOD, FL; Owner: CITICASTERS LICENSES, L.P.)
- WSRZ-FM (107.9 FM; CORAL COVE, FL; Owner: CITICASTERS LICENSES, L.P.)
- WHPT (102.5 FM; SARASOTA, FL; Owner: CXR HOLDINGS, INC.)
- WIKX (92.9 FM; CHARLOTTE HARBOR, FL; Owner: CITICASTERS LICENSES, L.P.)
- WCTQ (106.5 FM; SARASOTA, FL; Owner: CITICASTERS LICENSES, L.P.)
- WKZM (104.3 FM; SARASOTA, FL; Owner: THE MOODY BIBLE INSTITUTE OF CHICAGO)
- WINK-FM (96.9 FM; FORT MYERS, FL; Owner: FORT MYERS BROADCASTING COMPANY)
- WRXK-FM (96.1 FM; BONITA SPRINGS, FL; Owner: WRXK LICENSE LIMITED PARTNERSHIP)
- WSJT (94.1 FM; LAKELAND, FL; Owner: INFINITY RADIO OPERATIONS INC.)
- WPOI (101.5 FM; ST. PETERSBURG, FL; Owner: CXR HOLDINGS, INC.)
- WWRM (94.9 FM; TAMPA, FL; Owner: COX RADIO, INC.)
- WXKB (103.9 FM; CAPE CORAL, FL; Owner: WXKB LICENSE LIMITED PARTNERSHIP)
- WBCG (98.9 FM; MURDOCK, FL; Owner: CONCORD MEDIA GROUP, INC.)
- WSEB (91.3 FM; ENGLEWOOD, FL; Owner: SUNCOAST EDUCATIONAL B/CNG CORP.)
TV broadcast stations around Venice:
- WVEA-TV (Channel 62; VENICE, FL; Owner: ENTRAVISION HOLDINGS, LLC)
- W56CN (Channel 56; VENICE, FL; Owner: WMOR-TV COMPANY)
- W48CN (Channel 48; SARASOTA, FL; Owner: NATIONAL MINORITY T.V., INC.)
- WINK-TV (Channel 11; FORT MYERS, FL; Owner: FORT MYERS BROADCASTING COMPANY)
- WEDU (Channel 3; TAMPA, FL; Owner: FLORIDA WEST COAST PUBLIC BROADCASTING, INC.)
- WFTX (Channel 36; CAPE CORAL, FL; Owner: EMMIS TELEVISION LICENSE CORPORATION)
- WTVK (Channel 46; NAPLES, FL; Owner: ACME TELEVISION LICENSES OF FLORIDA, LLC)
- WBBH-TV (Channel 20; FORT MYERS, FL; Owner: WATERMAN BROADCASTING CORP. OF FLORIDA)
- WRXY-TV (Channel 49; TICE, FL; Owner: WEST COAST CHRISTIAN TELEVISION, INC)
- WXPX (Channel 66; BRADENTON, FL; Owner: PAXSON COMMUNICATION LICENSE COMPANY, LLC)
- WTOG (Channel 44; ST. PETERSBURG, FL; Owner: VIACOM INTERNATIONAL INC.)
- WFLA-TV (Channel 8; TAMPA, FL; Owner: MEDIA GENERAL COMMUNICATIONS, INC.)
- WFTS-TV (Channel 28; TAMPA, FL; Owner: TAMPA BAY TELEVISION, INC.)
- WWSB (Channel 40; SARASOTA, FL; Owner: SOUTHERN BROADCAST CORPORATION OF SARASOTA)
- WTVT (Channel 13; TAMPA, FL; Owner: TVT LICENSE, INC.)
- WUSF-TV (Channel 16; TAMPA, FL; Owner: UNIVERSITY OF SOUTH FLORIDA)
- W34AW (Channel 34; SARASOTA, FL; Owner: THREE ANGELS BROADCASTING NETWORK, INC.)
- WTTA (Channel 38; ST. PETERSBURG, FL; Owner: BAY TELEVISION, INC.)
- WFTT (Channel 50; TAMPA, FL; Owner: TELEFUTURA TAMPA LLC)
- WCLF (Channel 22; CLEARWATER, FL; Owner: CHRISTIAN TELEVISION CORPORATION, INC.)
- WSVT-LP (Channel 18; BRADENTON, FL; Owner: WORD OF GOD FELLOWSHIP, INC.)
- W17CK (Channel 17; PORT CHARLOTTE, FL; Owner: TRINITY BROADCASTING NETWORK)
- National Bridge Inventory (NBI) Statistics
- 61Number of bridges
- 1,076ft / 328mTotal length
- 1,355,798Total average daily traffic
- 136,510Total average daily truck traffic
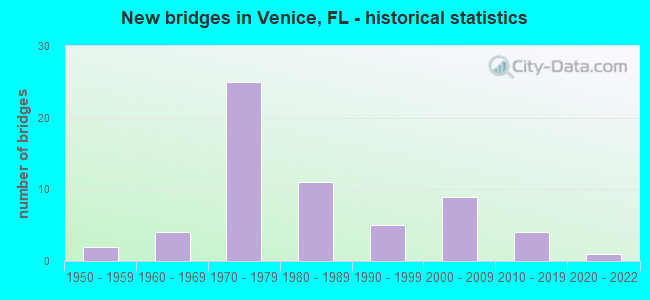
- New bridges - historical statistics
- 21950-1959
- 41960-1969
- 251970-1979
- 111980-1989
- 51990-1999
- 92000-2009
- 42010-2019
- 12020-2022
FCC Registered Antenna Towers: 242 (See the full list of FCC Registered Antenna Towers)
FCC Registered Commercial Land Mobile Towers: 4 (See the full list of FCC Registered Commercial Land Mobile Towers in Venice, FL)
FCC Registered Private Land Mobile Towers: 7 (See the full list of FCC Registered Private Land Mobile Towers)
FCC Registered Broadcast Land Mobile Towers: 65 (See the full list of FCC Registered Broadcast Land Mobile Towers)
FCC Registered Microwave Towers: 35 (See the full list of FCC Registered Microwave Towers in this town)
FCC Registered Paging Towers: 11 (See the full list of FCC Registered Paging Towers)
FCC Registered Maritime Coast & Aviation Ground Towers: 17 (See the full list of FCC Registered Maritime Coast & Aviation Ground Towers)
FCC Registered Amateur Radio Licenses: 573 (See the full list of FCC Registered Amateur Radio Licenses in Venice)
FAA Registered Aircraft Manufacturers and Dealers: 30 (See the full list of FAA Registered Manufacturers and Dealers in Venice)
FAA Registered Aircraft: 111 (See the full list of FAA Registered Aircraft)
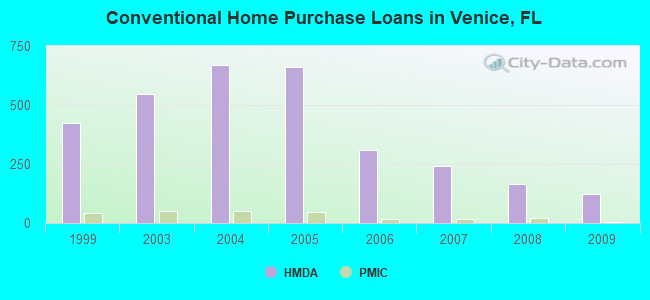
| Home Mortgage Disclosure Act Aggregated Statistics For Year 2009 (Based on 3 full and 2 partial tracts) | ||||||||||||||
| A) FHA, FSA/RHS & VA Home Purchase Loans | B) Conventional Home Purchase Loans | C) Refinancings | D) Home Improvement Loans | E) Loans on Dwellings For 5+ Families | F) Non-occupant Loans on < 5 Family Dwellings (A B C & D) | G) Loans On Manufactured Home Dwelling (A B C & D) | ||||||||
|---|---|---|---|---|---|---|---|---|---|---|---|---|---|---|
| Number | Average Value | Number | Average Value | Number | Average Value | Number | Average Value | Number | Average Value | Number | Average Value | Number | Average Value | |
| LOANS ORIGINATED | 8 | $153,436 | 125 | $156,171 | 232 | $192,436 | 8 | $93,681 | 1 | $150,000 | 143 | $187,922 | 4 | $54,465 |
| APPLICATIONS APPROVED, NOT ACCEPTED | 1 | $90,040 | 14 | $157,780 | 26 | $243,658 | 5 | $252,606 | 0 | $0 | 9 | $234,677 | 1 | $82,000 |
| APPLICATIONS DENIED | 7 | $138,790 | 23 | $123,995 | 110 | $217,187 | 8 | $56,285 | 0 | $0 | 46 | $156,617 | 5 | $70,868 |
| APPLICATIONS WITHDRAWN | 2 | $263,625 | 21 | $167,339 | 61 | $210,605 | 3 | $155,757 | 0 | $0 | 29 | $189,712 | 0 | $0 |
| FILES CLOSED FOR INCOMPLETENESS | 1 | $52,280 | 8 | $159,772 | 29 | $206,816 | 2 | $224,775 | 0 | $0 | 13 | $160,074 | 1 | $71,000 |
Detailed HMDA statistics for the following Tracts: 0023.01 , 0023.02, 0023.03, 0024.01, 0024.02
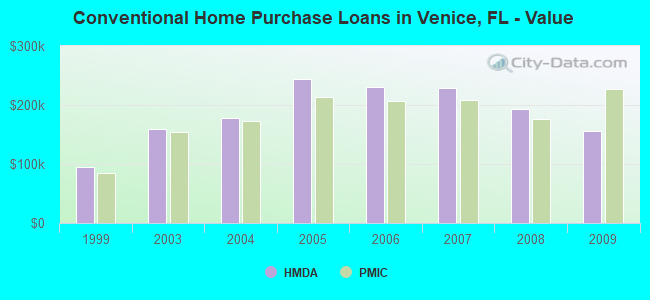
| Private Mortgage Insurance Companies Aggregated Statistics For Year 2009 (Based on 2 full and 1 partial tracts) | ||||||
| A) Conventional Home Purchase Loans | B) Refinancings | C) Non-occupant Loans on < 5 Family Dwellings (A & B) | ||||
|---|---|---|---|---|---|---|
| Number | Average Value | Number | Average Value | Number | Average Value | |
| LOANS ORIGINATED | 3 | $227,423 | 1 | $134,580 | 1 | $361,000 |
| APPLICATIONS APPROVED, NOT ACCEPTED | 0 | $0 | 0 | $0 | 0 | $0 |
| APPLICATIONS DENIED | 1 | $55,000 | 0 | $0 | 1 | $55,000 |
| APPLICATIONS WITHDRAWN | 0 | $0 | 0 | $0 | 0 | $0 |
| FILES CLOSED FOR INCOMPLETENESS | 0 | $0 | 0 | $0 | 0 | $0 |
Detailed PMIC statistics for the following Tracts: 0023.01 , 0023.02, 0023.03, 0024.01, 0024.02
2002 - 2018 National Fire Incident Reporting System (NFIRS) incidents
- Fire incident types reported to NFIRS in Venice, FL
- 84456.0%Outside Fires
- 37124.6%Structure Fires
- 24015.9%Mobile Property/Vehicle Fires
- 523.5%Other
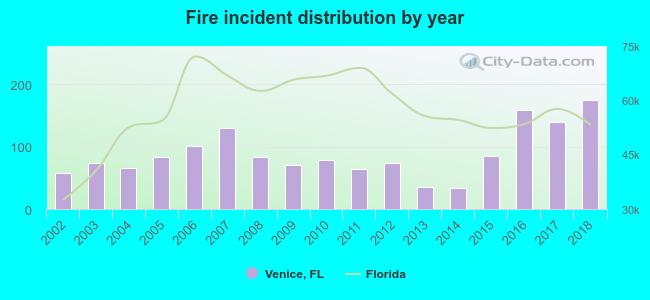 According to the data from the years 2002 - 2018 the average number of fires per year is 89. The highest number of reported fire incidents - 174 took place in 2018, and the least - 34 in 2014. The data has a growing trend.
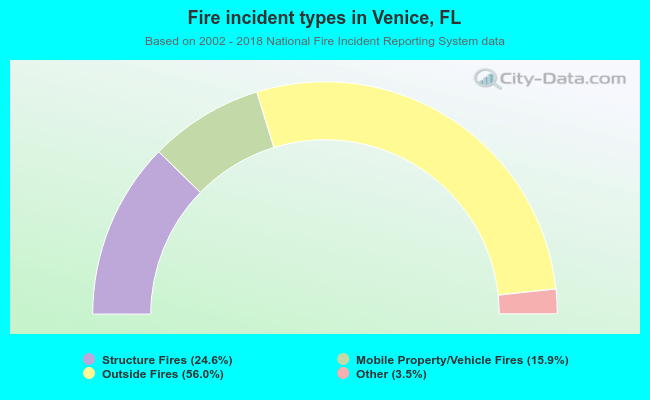 When looking into fire subcategories, the most reports belonged to: Outside Fires (56.0%), and Structure Fires (24.6%).
Fire-safe hotels and motels in Venice, Florida:
- Sun Glo Motel, 1746 S Tamiami TRL, Venice, Florida 34293
- Gondolier Motel, 340 S Tamiami TRL, Venice, Florida 34285
- Palos Heights Motel, 616 Golf Dr, Venice, Florida 34285
- Holiday House Of Venice, 455 US 41 Bypass N, Venice, Florida 34285 , Phone: (941) 485-5411, Fax: (941) 484-6193
- Veranda Inn & Cafe Of Venice, 625 S Tamiami Trail, Venice, Florida 34285 , Phone: (941) 484-9559, Fax: (941) 484-8235
- Best Western Ambassador Suites, 400 Commercial Court, Venice, Florida 34292 , Phone: (941) 480-9898, Fax: (941) 488-6692
- Hampton Inn & Suites, 881 Venetia Bay Blvd, Venice, Florida 34292 , Phone: (941) 488-5900, Fax: (941) 488-6746
- Holiday Inn Express Venice, 380 Commercial Ct, Venice, Florida 34292 , Phone: (941) 584-6800, Fax: (941) 584-6900
- 2 other hotels and motels
| Most common first names in Venice, FL among deceased individuals | ||
| Name | Count | Lived (average) |
|---|---|---|
| John | 580 | 80.2 years |
| Robert | 503 | 78.1 years |
| William | 485 | 79.8 years |
| Mary | 438 | 83.3 years |
| James | 368 | 78.6 years |
| Helen | 295 | 85.5 years |
| George | 279 | 80.7 years |
| Charles | 274 | 80.4 years |
| Joseph | 232 | 79.7 years |
| Dorothy | 228 | 84.2 years |
| Most common last names in Venice, FL among deceased individuals | ||
| Last name | Count | Lived (average) |
|---|---|---|
| Smith | 136 | 81.0 years |
| Johnson | 97 | 82.0 years |
| Brown | 88 | 81.3 years |
| Miller | 85 | 82.4 years |
| Wilson | 63 | 81.0 years |
| Williams | 59 | 81.8 years |
| Clark | 56 | 83.9 years |
| Anderson | 54 | 82.4 years |
| Jones | 51 | 79.5 years |
| Taylor | 46 | 80.8 years |
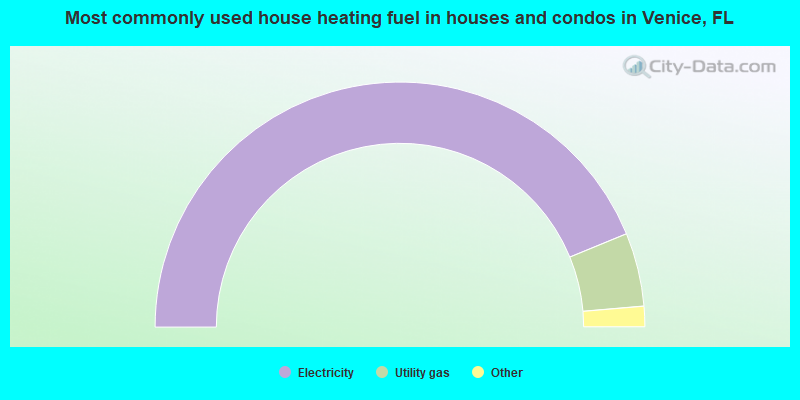
- 87.6%Electricity
- 9.7%Utility gas
- 1.5%No fuel used
- 1.1%Bottled, tank, or LP gas
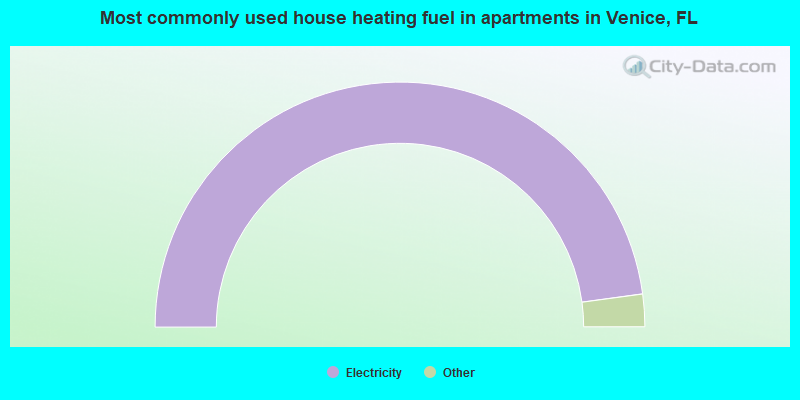
- 95.7%Electricity
- 2.4%No fuel used
- 1.6%Utility gas
- 0.3%Solar energy
Venice compared to Florida state average:
- Unemployed percentage significantly below state average.
- Black race population percentage significantly below state average.
- Hispanic race population percentage significantly below state average.
- Median age significantly above state average.
- Length of stay since moving in significantly above state average.
- Percentage of population with a bachelor's degree or higher above state average.
Venice on our top lists:
- #39 on the list of "Top 101 cities with the most people born in other U.S. states (population 5,000+)"
- #74 on the list of "Top 100 cities with oldest residents"
- #84 on the list of "Top 101 cities with largest percentage of females in industries: retail trade (population 5,000+)"
- #20 (34292) on the list of "Top 101 zip codes with the smallest percentage of returns reporting salary or wage in 2012 (pop 5,000+)"
- #2 on the list of "Top 101 counties with the largest number of people without health insurance coverage in 2000 (pop. 50,000+)"
- #4 on the list of "Top 101 counties with the largest decrease in the number of infant deaths per 1000 residents 2000-2006 to 2007-2013 (pop. 50,000+)"
- #5 on the list of "Top 101 counties with the lowest number of births per 1000 residents 2007-2013"
- #6 on the list of "Top 101 counties with the lowest number of infant deaths per 1000 residents 2007-2013 (pop. 50,000+)"
- #16 on the list of "Top 101 counties with the highest number of deaths per 1000 residents 2007-2013 (pop. 50,000+)"

|
|
Total of 177 patent applications in 2008-2024.