Wakefield: Fire Incidents, Massachusetts (MA)
Where are fire incidents reported in Wakefield, MA
Something went wrong! Please refresh the page.
| Fire incidents reported | |
|---|---|
| Sreet name | Count |
| MAIN ST | 168 |
| SALEM ST | 76 |
| AUDUBON RD | 50 |
| WATER ST | 50 |
| ALBION ST | 38 |
| NORTH AVE | 36 |
| CHESTNUT ST | 32 |
| LOWELL ST | 32 |
| BROADWAY | 28 |
| VERNON ST | 28 |
| GOULD ST | 26 |
| NEW SALEM ST | 22 |
| CEDAR ST | 20 |
| PRINCESS ST | 20 |
| OAK ST | 18 |
| PLEASANT ST | 18 |
| SPRING ST | 18 |
| CRESCENT ST | 16 |
| ELM ST | 16 |
| FARM ST | 16 |
| MADISON AVE | 16 |
| BARTLEY ST | 14 |
| HARRISON AVE | 14 |
| LAFAYETTE ST | 14 |
| STARK AVE | 14 |
| HARTS HILL RD | 12 |
| KENDRICK RD | 12 |
| NAHANT ST | 12 |
| OLD COLONY DR | 12 |
| ORSINI DR | 12 |
| Other | 166 |
2002 - 2018 National Fire Incident Reporting System (NFIRS) incidents
- Incident types reported to NFIRS in Wakefield, MA
- 1,02660.4%Fire
- 33920.0%False Alarm
- 23513.8%Hazardous Condition
- 412.4%Service Call
- 382.2%Rescue & EMS
- 181.1%Good Intent Call
- Fire incident types reported to NFIRS in Wakefield, MA
- 80378.3%Structure Fires
- 16616.2%Mobile Property/Vehicle Fires
- 373.6%Outside Fires
- 201.9%Other
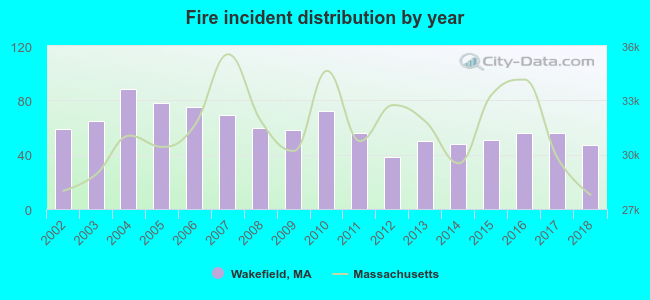 Based on the data from the years 2002 - 2018 the average number of fire incidents per year is 60. The highest number of reported fire incidents - 88 took place in 2004, and the least - 38 in 2012. The data has a declining trend.
The average number of yearly fire incidents per 10k residents in Wakefield, MA compared to nearest cities:
(Note: Based on data for the last 3 years, including only cities with population 5,000 and above)
| Wakefield: | 21.3 |
| Stoneham: | 58.2 |
| Reading: | 29.9 |
| Lynnfield: | 81.9 |
| Melrose: | 6.6 |
| Saugus: | 48.2 |
| Woburn: | 52.0 |
| Winchester: | 12.9 |
| Malden: | 22.3 |
 The median response time based on all reported fire incidents is 2 minutes. This is much lower compared to the Massachusetts median value.
The median response time in Wakefield, MA compared to nearest cities:
(Note: Based on data for all years, including only cities with at least 500 fire incidents)
| Wakefield: | 2 minutes |
| Stoneham: | 3 minutes |
| Reading: | 4 minutes |
| Lynnfield: | 5 minutes |
| Saugus: | 5 minutes |
| Woburn: | 4 minutes |
| Winchester: | 4 minutes |
| Malden: | 3 minutes |
| North Reading: | 4 minutes |
 Based on the data from the years 2002 - 2018 the average number of fire-related fatalities per year is 0. The highest number of deaths - 1 took place in 2003, and the lowest - 0 in 2002. The data has a constant trend.
 According to the data from the years 2002 - 2018 the average number of fire-related casualties per year is 0. The highest number of reported casualties - 1 took place in 2005, and the lowest - 0 in 2002. The data has a constant trend.
The average number of casualties per 1,000 fire incidents is 6. This indicator was the highest - 21 in 2014, and the lowest 0 in 2002. The trend for injuries per 1,000 fires is constant. Compared to the Massachusetts value the number of injuries per 1,000 fire incidents is lower.
According to the data from the years 2002 - 2018 the average number of fire-related casualties per year is 0. The highest number of reported casualties - 1 took place in 2005, and the lowest - 0 in 2002. The data has a constant trend.
The average number of casualties per 1,000 fire incidents is 6. This indicator was the highest - 21 in 2014, and the lowest 0 in 2002. The trend for injuries per 1,000 fires is constant. Compared to the Massachusetts value the number of injuries per 1,000 fire incidents is lower.Casualties per 1,000 incidents in Wakefield, MA compared to nearest cities:
(Note: Based on data for all years, including only cities with at least 500 fire incidents)
| Wakefield: | 5.8 |
| Stoneham: | 3.8 |
| Reading: | 5.2 |
| Lynnfield: | 2.5 |
| Saugus: | 11.2 |
| Woburn: | 14.5 |
| Winchester: | 24.3 |
| Malden: | 7.3 |
| North Reading: | 6.7 |
 33.4% incidents where reported in the morning and 66.6% in the evening. The most fires (16.7%) took place on Tuesday, and the least (12.7%) on Friday.
 According to the 1,026 reports from years 2002 - 2018 most fires (11.0%) took place during March, and the least (6.7%) in June.
 Out of all 1,698 cases reported during the years 2002 - 2018, the most belonged to the categories: Fire (60.4%), Good Intent Call (20.0%), and Rescue & EMS (13.8%).
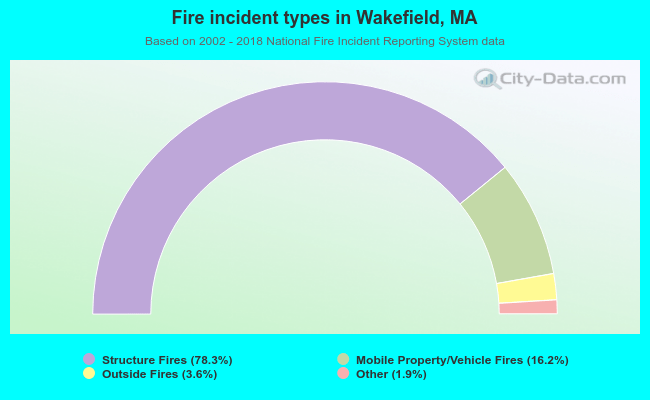 When looking into fire subcategories, the most incidents belonged to: Structure Fires (78.3%), and Mobile Property/Vehicle Fires (16.2%).