Waterloo: Fire Incidents, New York (NY)
Where are fire incidents reported in Waterloo, NY
Something went wrong! Please refresh the page.
|
| |||||||||||||||||||||||||||||||||||||||||||||||||||||||||||||||||||||||||||||||||||||||||||||||||||||||||||||
2004 - 2018 National Fire Incident Reporting System (NFIRS) incidents
- Incident types reported to NFIRS in Waterloo, NY
- 86424.6%Hazardous Condition
- 76921.9%Rescue & EMS
- 60517.2%Fire
- 44212.6%Service Call
- 44112.5%False Alarm
- 38711.0%Good Intent Call
- 50.1%Special Incident
- Fire incident types reported to NFIRS in Waterloo, NY
- 30249.9%Structure Fires
- 12620.8%Other
- 11118.3%Outside Fires
- 6610.9%Mobile Property/Vehicle Fires
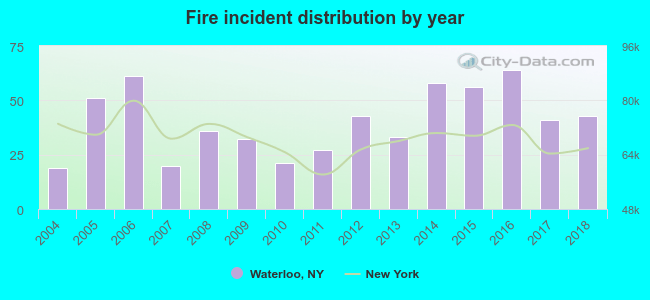 According to the data from the years 2004 - 2018 the average number of fire incidents per year is 40. The highest number of fires - 64 took place in 2016, and the least - 19 in 2004. The data has an increasing trend.
The average number of yearly fire incidents per 10k residents in Waterloo, NY compared to nearest cities:
(Note: Based on data for the last 3 years, including only cities with population 5,000 and above)
| Waterloo: | 97.7 |
| Seneca Falls: | 77.4 |
| Geneva: | 50.2 |
| Auburn: | 52.8 |
| Newark: | 26.2 |
| Arcadia: | 2.1 |
| Penn Yan: | 32.3 |
| Canandaigua: | 116.0 |
| Farmington: | 38.3 |
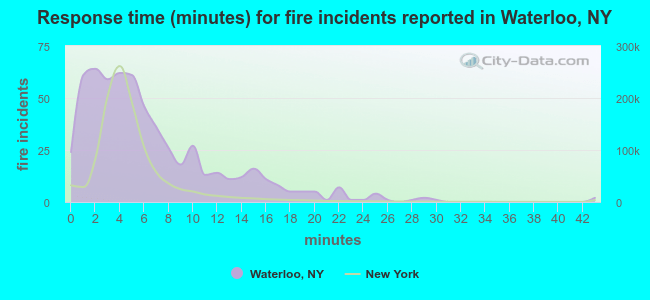 The median response time based on all reported fire incidents is 5 minutes. This is higher than the New York median value.
The median response time in Waterloo, NY compared to nearest cities:
(Note: Based on data for all years, including only cities with at least 500 fire incidents)
| Waterloo: | 5 minutes |
| Seneca Falls: | 5 minutes |
| Geneva: | 2 minutes |
| Auburn: | 5 minutes |
| Newark: | 5 minutes |
| Canandaigua: | 4 minutes |
| Skaneateles: | 11 minutes |
| Farmington: | 7 minutes |
| Moravia: | 11 minutes |
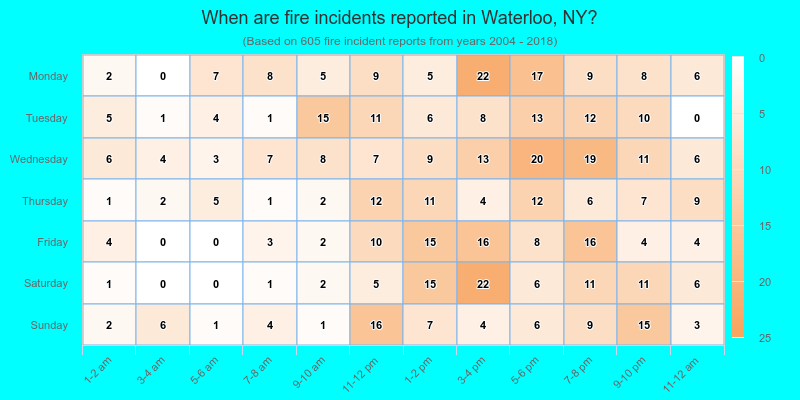
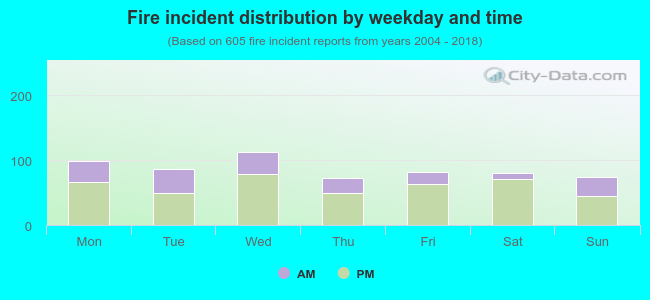 30.4% incidents where reported in the morning and 69.6% in the evening. The most fires (18.7%) took place on Wednesday, and the least (11.9%) on Thursday.
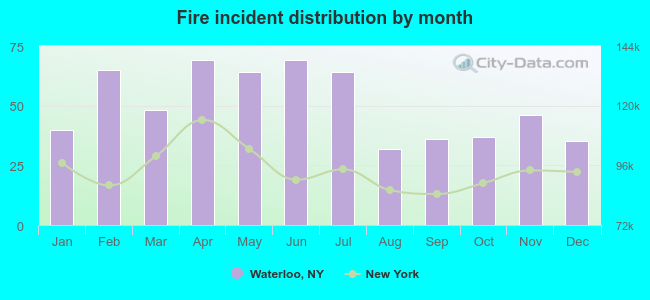 Based on the 605 incident reports from years 2004 - 2018 most fires (11.4%) took place during April, and the least (5.3%) in August.
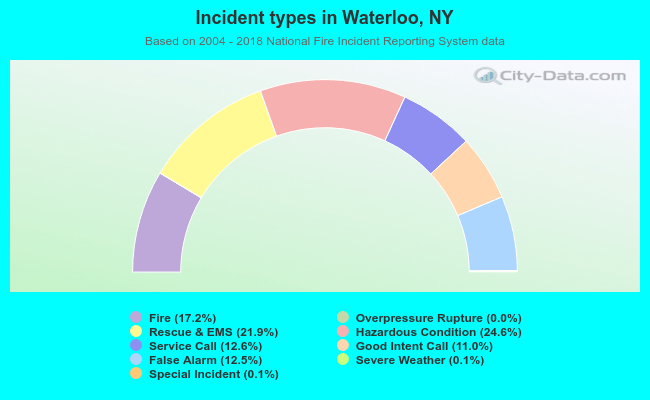 Out of all 3,517 cases reported during the years 2004 - 2018, the most belonged to the categories: Hazardous Condition (24.6%), Rescue & EMS (21.9%), and Fire (17.2%).
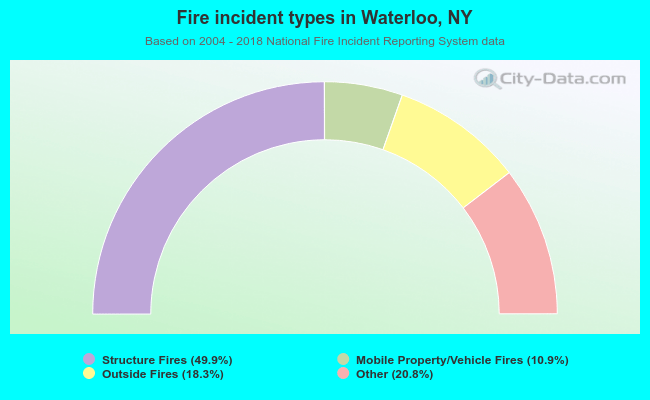 When looking into fire subcategories, the most incidents belonged to: Structure Fires (49.9%), and Other (20.8%).