Westerly: Fire Incidents, Rhode Island (RI)
Where are fire incidents reported in Westerly, RI
Something went wrong! Please refresh the page.
|
| |||||||||||||||||||||||||||||||||||||||||||||||||||||||||||||||||||||||||||||||||||||||||||||||||||||||||||||
2007 - 2018 National Fire Incident Reporting System (NFIRS) incidents
- Incident types reported to NFIRS in Westerly, RI
- 94328.5%Hazardous Condition
- 83225.1%False Alarm
- 67220.3%Rescue & EMS
- 3159.5%Fire
- 2758.3%Good Intent Call
- 2738.2%Service Call
- Fire incident types reported to NFIRS in Westerly, RI
- 24176.5%Structure Fires
- 5316.8%Outside Fires
- 185.7%Mobile Property/Vehicle Fires
- 31.0%Other
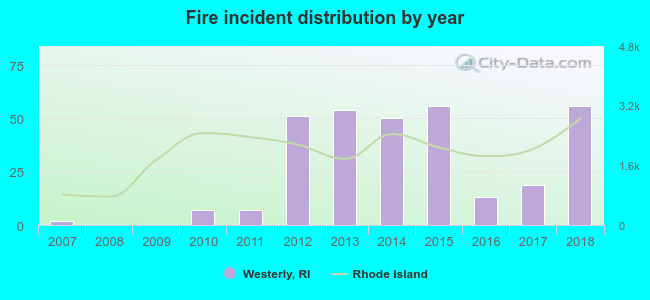 According to the data from the years 2007 - 2018 the average number of fire incidents per year is 26. The highest number of fire incidents - 56 took place in 2015, and the least - 0 in 2008. The data has a growing trend.
The average number of yearly fire incidents per 10k residents in Westerly, RI compared to nearest cities:
(Note: Based on data for the last 3 years, including only cities with population 5,000 and above)
| Westerly: | 16.4 |
| Hopkinton: | 4.5 |
| Charlestown: | 25.6 |
| Richmond: | 11.7 |
| South Kingstown: | 15.7 |
| Kingston: | 35.8 |
| Exeter: | 64.9 |
| Narragansett: | 31.3 |
| West Greenwich: | 62.5 |

 According to the reports from the years 2007 - 2018 the average number of fire-related casualties per year is 1. The highest number of reported injuries - 5 took place in 2014, and the lowest - 0 in 2007. The data has a growing trend.
 29.2% incidents where reported in the morning and 70.8% in the evening. The most fires (17.1%) took place on Tuesday, and the least (12.4%) on Sunday.
 Based on the 315 fire incident reports from years 2007 - 2018 most fires (11.7%) took place during January, and the least (6.0%) in February.
 Out of all 3,314 cases reported during the years 2007 - 2018, the most belonged to the categories: Hazardous Condition (28.5%), False Alarm (25.1%), and Rescue & EMS (20.3%).
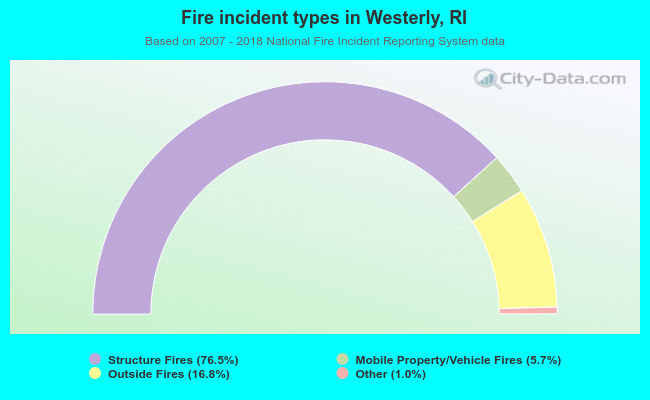 When looking into fire subcategories, the most incidents belonged to: Structure Fires (76.5%), and Outside Fires (16.8%).