Weston: Fire Incidents, Florida (FL)
Where are fire incidents reported in Weston, FL
Something went wrong! Please refresh the page.
| Fire incidents reported | |
|---|---|
| Sreet name | Count |
| WESTON RD | 110 |
| US HWY | 98 |
| RACQUET CLUB RD | 92 |
| LAKEVIEW DR | 90 |
| I75 | 76 |
| INDIAN TRC | 74 |
| BONAVENTURE BLVD | 56 |
| US 27 HWY | 38 |
| ROYAL PALM BLVD | 34 |
| 36TH ST | 32 |
| COMMERCE PKY | 30 |
| SADDLE CLUB RD | 30 |
| POST RD | 28 |
| I-75 | 26 |
| I75 RAMP | 26 |
| BLATT BLVD | 24 |
| GOLF CLUB RD | 24 |
| ST TROPEZ CIR | 24 |
| MARKET ST | 18 |
| SR 84 | 18 |
| POND RIDGE CIR | 16 |
| CORPORATE LAKES BLVD | 14 |
| FAIRLAKE TRC | 14 |
| PINEWOOD LN | 14 |
| CHENILLE CIR | 12 |
| EMERALD ESTATES DR | 12 |
| MAIN ST | 12 |
| CAPRI LN | 10 |
| CONSERVATION DR | 10 |
| GARDENIA AVE | 10 |
| Other | 109 |
2004 - 2018 National Fire Incident Reporting System (NFIRS) incidents
- Incident types reported to NFIRS in Weston, FL
- 11,32158.8%Rescue & EMS
- 2,11911.0%Good Intent Call
- 1,8739.7%False Alarm
- 1,5858.2%Service Call
- 1,1816.1%Fire
- 1,1706.1%Hazardous Condition
- Fire incident types reported to NFIRS in Weston, FL
- 43036.4%Structure Fires
- 37231.5%Outside Fires
- 31927.0%Mobile Property/Vehicle Fires
- 605.1%Other
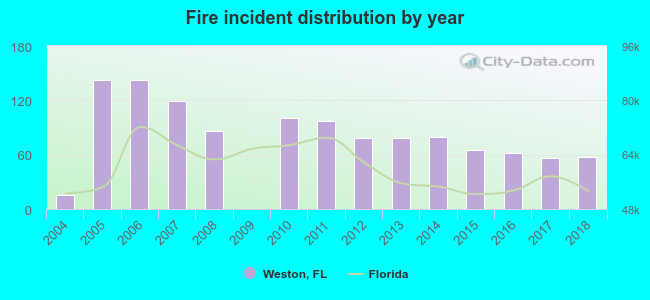 Based on the data from the years 2004 - 2018 the average number of fires per year is 79. The highest number of reported fires - 143 took place in 2005, and the least - 0 in 2009. The data has a growing trend.
The average number of yearly fire incidents per 10k residents in Weston, FL compared to nearest cities:
(Note: Based on data for the last 3 years, including only cities with population 5,000 and above)
| Weston: | 8.4 |
| Southwest Ranches: | 40.8 |
| Davie: | 21.9 |
| Sunrise: | 16.0 |
| Cooper City: | 8.4 |
| Pembroke Pines: | 7.4 |
| Plantation: | 10.4 |
| Lauderhill: | 24.5 |
| Tamarac: | 11.5 |
 The median response time based on all reported fire incidents is 6 minutes. This is similar to the Florida median value.
The median response time in Weston, FL compared to nearest cities:
(Note: Based on data for all years, including only cities with at least 500 fire incidents)
| Weston: | 6 minutes |
| Southwest Ranches: | 7 minutes |
| Davie: | 7 minutes |
| Sunrise: | 6 minutes |
| Cooper City: | 6 minutes |
| Pembroke Pines: | 5 minutes |
| Plantation: | 7 minutes |
| Lauderhill: | 6 minutes |
| Tamarac: | 6 minutes |
 Based on the reports from the years 2004 - 2018 the average number of fire-related casualties per year is 2. The highest number of casualties - 4 took place in 2013, and the lowest - 0 in 2004. The data has a constant trend.
The average number of casualties per 1,000 fire incidents is 19. This indicator was the highest - 51 in 2013, and the lowest 0 in 2004. The trend for casualties per 1,000 fire incidents is decreasing. Compared to the Florida value the number of injuries per 1,000 incidents is higher.
Based on the reports from the years 2004 - 2018 the average number of fire-related casualties per year is 2. The highest number of casualties - 4 took place in 2013, and the lowest - 0 in 2004. The data has a constant trend.
The average number of casualties per 1,000 fire incidents is 19. This indicator was the highest - 51 in 2013, and the lowest 0 in 2004. The trend for casualties per 1,000 fire incidents is decreasing. Compared to the Florida value the number of injuries per 1,000 incidents is higher.Casualties per 1,000 incidents in Weston, FL compared to nearest cities:
(Note: Based on data for all years, including only cities with at least 500 fire incidents)
| Weston: | 21.2 |
| Southwest Ranches: | 3.0 |
| Davie: | 14.2 |
| Sunrise: | 32.6 |
| Cooper City: | 28.6 |
| Pembroke Pines: | 31.2 |
| Plantation: | 6.6 |
| Lauderhill: | 39.2 |
| Tamarac: | 7.1 |
 27.4% incidents where reported in the morning and 72.6% in the evening. The most fires (16.2%) took place on Thursday, and the least (12.2%) on Sunday.
 Based on the 1,181 fire incident reports from years 2004 - 2018 most fires (10.6%) took place during January, and the least (6.6%) in September.
 Out of all 19,261 cases reported during the years 2004 - 2018, the most belonged to the categories: Rescue & EMS (58.8%), Good Intent Call (11.0%), and False Alarm (9.7%).
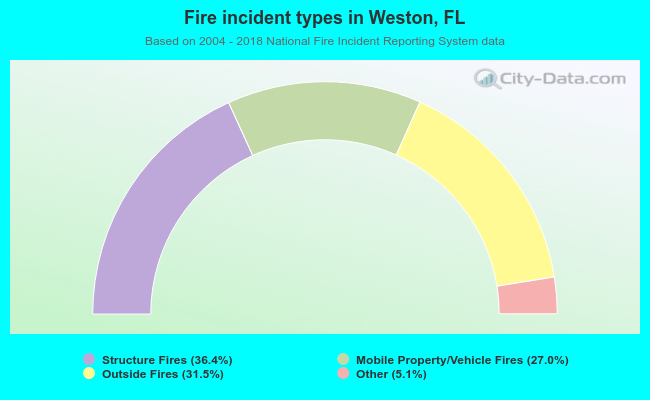 When looking into fire subcategories, the most incidents belonged to: Structure Fires (36.4%), and Outside Fires (31.5%).