Westwego: Fire Incidents, Louisiana (LA)
Where are fire incidents reported in Westwego, LA
Something went wrong! Please refresh the page.
|
| |||||||||||||||||||||||||||||||||||||||||||||||||||||||||||||||||||||||||||||||||||||||||||||||||||||||||||||
2002 - 2018 National Fire Incident Reporting System (NFIRS) incidents
- Incident types reported to NFIRS in Westwego, LA
- 99037.5%Hazardous Condition
- 66525.2%Fire
- 28911.0%False Alarm
- 27810.5%Rescue & EMS
- 2007.6%Good Intent Call
- 1977.5%Service Call
- 70.3%Overpressure Rupture
- 70.3%Special Incident
- 50.2%Severe Weather
- Fire incident types reported to NFIRS in Westwego, LA
- 37055.6%Structure Fires
- 16925.4%Outside Fires
- 12318.5%Mobile Property/Vehicle Fires
- 30.5%Other
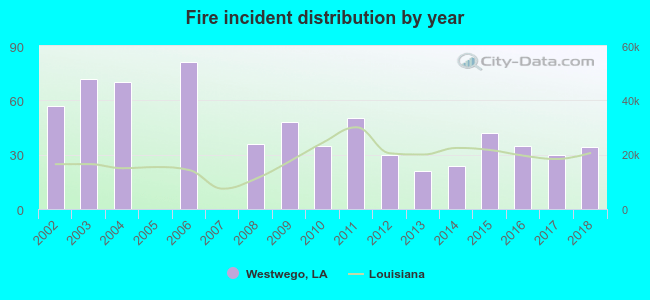 According to the data from the years 2002 - 2018 the average number of fire incidents per year is 39. The highest number of reported fires - 81 took place in 2006, and the least - 0 in 2005. The data has a dropping trend.
The average number of yearly fire incidents per 10k residents in Westwego, LA compared to nearest cities:
(Note: Based on data for the last 3 years, including only cities with population 5,000 and above)
| Westwego: | 38.6 |
| Bridge City: | 23.4 |
| Marrero: | 60.6 |
| Jefferson: | 47.1 |
| Harahan: | 3.9 |
| Harvey: | 77.3 |
| Gretna: | 38.5 |
| Waggaman: | 26.3 |
| River Ridge: | 15.3 |
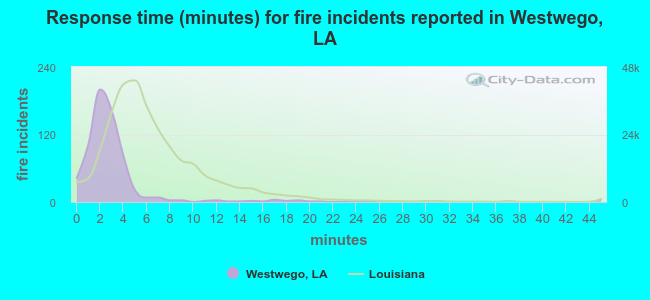 The median response time based on all reported fire incidents is 2 minutes. This is much lower than the Louisiana median value.
The median response time in Westwego, LA compared to nearest cities:
(Note: Based on data for all years, including only cities with at least 500 fire incidents)
| Westwego: | 2 minutes |
| Marrero: | 4 minutes |
| Avondale: | 3 minutes |
| Jefferson: | 4 minutes |
| Harvey: | 4 minutes |
| Gretna: | 3 minutes |
| Terrytown: | 4 minutes |
| Metairie: | 4 minutes |
| New Orleans: | 5 minutes |
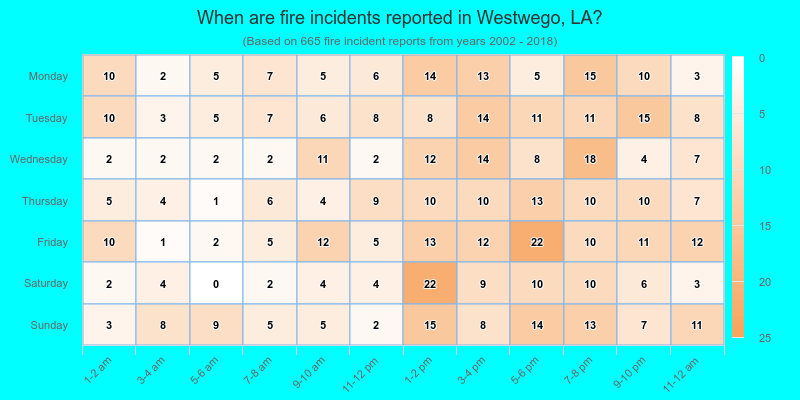
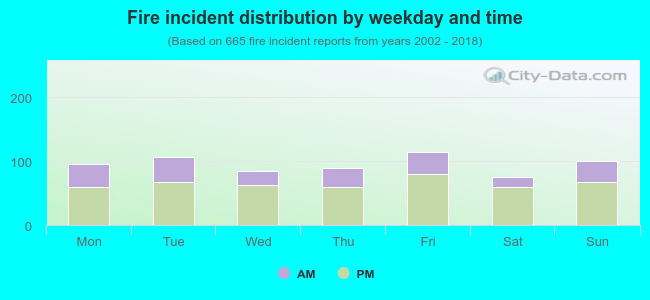 31.1% incidents where reported in the morning and 68.9% in the evening. The most fires (17.3%) took place on Friday, and the least (11.4%) on Saturday.
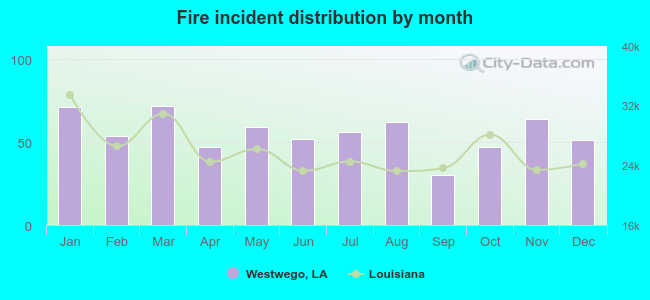 Based on the 665 reports from years 2002 - 2018 most fires (10.8%) took place during March, and the least (4.5%) in September.
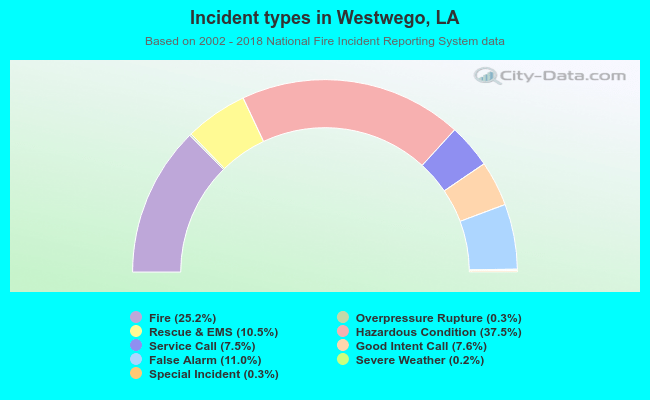 Out of all 2,638 cases reported during the years 2002 - 2018, the most belonged to the categories: Hazardous Condition (37.5%), Fire (25.2%), and False Alarm (11.0%).
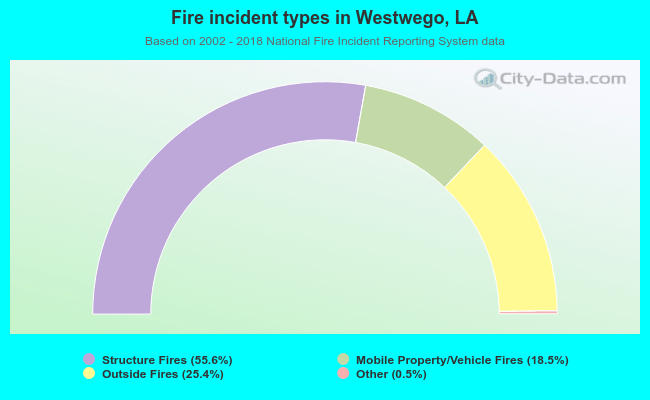 When looking into fire subcategories, the most incidents belonged to: Structure Fires (55.6%), and Outside Fires (25.4%).