Wheeling: Fire Incidents, Illinois (IL)
Where are fire incidents reported in Wheeling, IL
Something went wrong! Please refresh the page.
| Fire incidents reported | |
|---|---|
| Sreet name | Count |
| MILWAUKEE AVE | 150 |
| WOLF RD | 130 |
| DUNDEE RD | 128 |
| HINTZ RD | 118 |
| MCHENRY RD | 118 |
| WHEELING RD | 86 |
| MANDA LN | 74 |
| PLEASANT RUN DR | 74 |
| PALATINE RD | 52 |
| LAKE COOK RD | 46 |
| INLAND DR | 42 |
| SCHOENBECK RD | 42 |
| FAIRWAY VIEW DR | 38 |
| CAPITOL DR | 36 |
| MESSNER DR | 36 |
| NORTHGATE PKY | 36 |
| OAK CREEK DR | 34 |
| NEWBURN CT | 32 |
| CARPENTER AVE | 30 |
| ELMHURST RD | 30 |
| WOODCREEK RD | 30 |
| CHADDICK DR | 28 |
| ANTHONY RD | 26 |
| MILWAUKEE AV | 26 |
| OUT OF DISTRICT | 24 |
| FOSTER AVE | 22 |
| MANCHESTER DR | 20 |
| MARK LN | 20 |
| SCOTT ST | 20 |
| STRONG ST | 20 |
| Other | 73 |
2002 - 2018 National Fire Incident Reporting System (NFIRS) incidents
- Incident types reported to NFIRS in Wheeling, IL
- 14,85755.5%Rescue & EMS
- 4,25815.9%False Alarm
- 2,4159.0%Hazardous Condition
- 2,0117.5%Good Intent Call
- 1,6416.1%Fire
- 1,5205.7%Service Call
- 350.1%Overpressure Rupture
- Fire incident types reported to NFIRS in Wheeling, IL
- 87853.5%Structure Fires
- 45827.9%Outside Fires
- 23714.4%Mobile Property/Vehicle Fires
- 684.1%Other
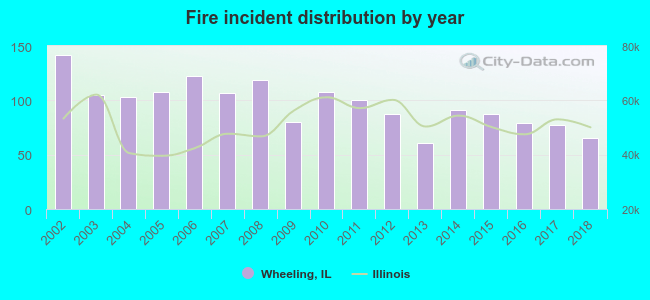 Based on the data from the years 2002 - 2018 the average number of fires per year is 97. The highest number of reported fire incidents - 142 took place in 2002, and the least - 61 in 2013. The data has a decreasing trend.
The average number of yearly fire incidents per 10k residents in Wheeling, IL compared to nearest cities:
(Note: Based on data for the last 3 years, including only cities with population 5,000 and above)
| Wheeling: | 19.4 |
| Prospect Heights: | 27.4 |
| Buffalo Grove: | 20.4 |
| Arlington Heights: | 3.7 |
| Lincolnshire: | 47.1 |
| Northbrook: | 21.9 |
| Mount Prospect: | 18.4 |
| Deerfield: | 26.5 |
| Palatine: | 20.6 |
 The median response time based on all reported fire incidents is 5 minutes. This is comparable to the state median value.
The median response time in Wheeling, IL compared to nearest cities:
(Note: Based on data for all years, including only cities with at least 500 fire incidents)
| Wheeling: | 5 minutes |
| Prospect Heights: | 5 minutes |
| Buffalo Grove: | 5 minutes |
| Arlington Heights: | 5 minutes |
| Lincolnshire: | 4 minutes |
| Northbrook: | 5 minutes |
| Mount Prospect: | 5 minutes |
| Deerfield: | 5 minutes |
| Palatine: | 5 minutes |
 According to the data from the years 2002 - 2018 the average number of fire-related yearly casualties is 6. The highest number of reported injuries - 15 took place in 2003, and the lowest - 0 in 2013. The data has a decreasing trend.
The average number of casualties per 1,000 fires is 55. This indicator was the highest - 143 in 2003, and the lowest 0 in 2013. The trend for injuries per 1,000 fire incidents is decreasing. Compared to the state value the number of casualties per 1,000 fires is much higher.
According to the data from the years 2002 - 2018 the average number of fire-related yearly casualties is 6. The highest number of reported injuries - 15 took place in 2003, and the lowest - 0 in 2013. The data has a decreasing trend.
The average number of casualties per 1,000 fires is 55. This indicator was the highest - 143 in 2003, and the lowest 0 in 2013. The trend for injuries per 1,000 fire incidents is decreasing. Compared to the state value the number of casualties per 1,000 fires is much higher.Casualties per 1,000 incidents in Wheeling, IL compared to nearest cities:
(Note: Based on data for all years, including only cities with at least 500 fire incidents)
| Wheeling: | 57.3 |
| Prospect Heights: | 20.1 |
| Buffalo Grove: | 19.4 |
| Arlington Heights: | 31.4 |
| Lincolnshire: | 8.4 |
| Northbrook: | 17.2 |
| Mount Prospect: | 28.0 |
| Deerfield: | 16.6 |
| Palatine: | 16.4 |
 32.4% incidents where reported in the morning and 67.6% in the evening. The most fires (17.6%) took place on Tuesday, and the least (12.6%) on Saturday.
 Based on the 1,641 reports from years 2002 - 2018 most fires (9.3%) took place during April, and the least (5.6%) in December.
 Out of all 26,759 cases reported during the years 2002 - 2018, the most belonged to the categories: Rescue & EMS (55.5%), False Alarm (15.9%), and Hazardous Condition (9.0%).
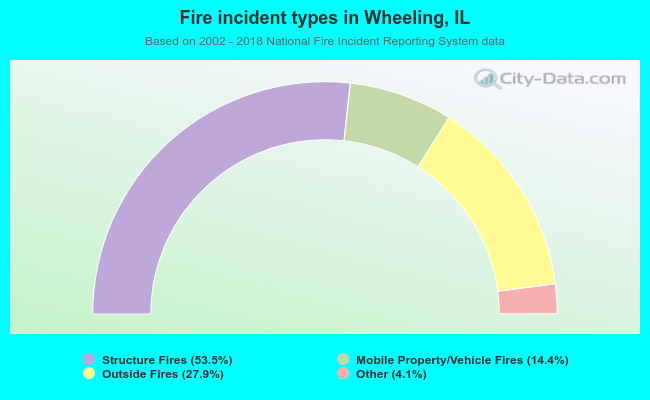 When looking into fire subcategories, the most incidents belonged to: Structure Fires (53.5%), and Outside Fires (27.9%).