Whittier: Fire Incidents, California (CA)
Where are fire incidents reported in Whittier, CA
Something went wrong! Please refresh the page.
| Fire incidents reported | |
|---|---|
| Sreet name | Count |
| WHITTIER | 250 |
| GREENLEAF | 128 |
| MILTON | 92 |
| PICKERING | 84 |
| PAINTER | 80 |
| BRIGHT | 68 |
| WASHINGTON | 66 |
| COMSTOCK | 62 |
| LAMBERT | 60 |
| PHILADELPHIA | 56 |
| HADLEY | 50 |
| NEWLIN | 46 |
| BEVERLY | 42 |
| COLIMA | 40 |
| MAR VISTA | 40 |
| PENN | 30 |
| BROADWAY | 24 |
| CAMILLA | 24 |
| FRIENDS | 24 |
| LEFFINGWELL | 24 |
| NORWALK | 24 |
| SANTA FE SPRINGS | 24 |
| PALM | 22 |
| SANTA GERTRUDES | 22 |
| SCOTT | 22 |
| LA CUARTA | 18 |
| STARBUCK | 18 |
| MULBERRY | 16 |
| OAK | 16 |
| YOUNGWOOD | 16 |
2005 - 2018 National Fire Incident Reporting System (NFIRS) incidents
- Incident types reported to NFIRS in Whittier, CA
- 22,42569.5%Rescue & EMS
- 4,95015.3%Good Intent Call
- 1,7425.4%False Alarm
- 1,2633.9%Fire
- 1,0453.2%Service Call
- 7532.3%Hazardous Condition
- 530.2%Special Incident
- Fire incident types reported to NFIRS in Whittier, CA
- 49439.1%Outside Fires
- 41833.1%Structure Fires
- 23618.7%Mobile Property/Vehicle Fires
- 1159.1%Other
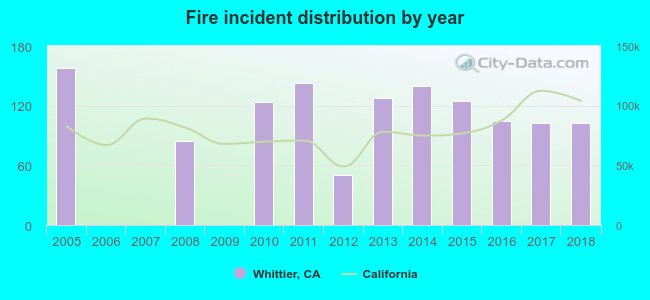 According to the data from the years 2005 - 2018 the average number of fire incidents per year is 90. The highest number of fires - 158 took place in 2005, and the least - 0 in 2006. The data has a dropping trend.
The average number of yearly fire incidents per 10k residents in Whittier, CA compared to nearest cities:
(Note: Based on data for the last 3 years, including only cities with population 5,000 and above)
| Whittier: | 11.9 |
| Santa Fe Springs: | 47.1 |
| Hacienda Heights: | 11.5 |
| Pico Rivera: | 15.8 |
| La Habra Heights: | 18.9 |
| La Mirada: | 7.6 |
| La Habra: | 10.7 |
| Norwalk: | 12.2 |
| South El Monte: | 26.1 |
 The median response time based on all reported fire incidents is 4 minutes. This is lower compared to the state median value.
The median response time in Whittier, CA compared to nearest cities:
(Note: Based on data for all years, including only cities with at least 500 fire incidents)
| Whittier: | 4 minutes |
| Santa Fe Springs: | 7 minutes |
| Hacienda Heights: | 6 minutes |
| Pico Rivera: | 5 minutes |
| La Mirada: | 5 minutes |
| La Habra: | 5 minutes |
| Norwalk: | 5 minutes |
| Industry: | 6 minutes |
| Montebello: | 7 minutes |
 34.6% incidents where reported in the morning and 65.4% in the evening. The most fires (16.2%) took place on Sunday, and the least (13.2%) on Wednesday.
 According to the 1,263 fire incident reports from years 2005 - 2018 most fires (11.5%) took place during January, and the least (6.1%) in September.
 Out of all 32,252 cases reported during the years 2005 - 2018, the most belonged to the categories: Rescue & EMS (69.5%), Good Intent Call (15.3%), and False Alarm (5.4%).
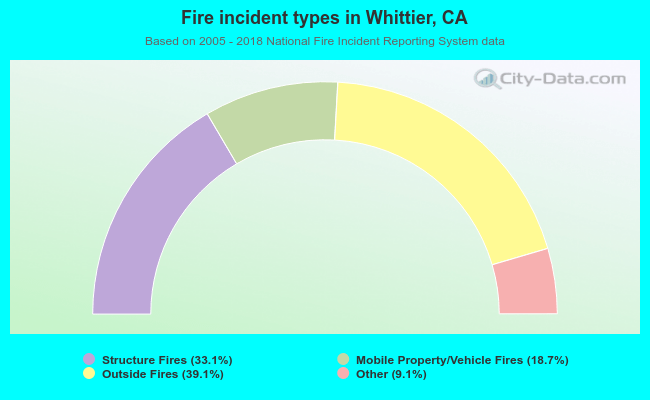 When looking into fire subcategories, the most incidents belonged to: Outside Fires (39.1%), and Structure Fires (33.1%).