Zachary: Fire Incidents, Louisiana (LA)
Where are fire incidents reported in Zachary, LA
Something went wrong! Please refresh the page.
| Fire incidents reported | |
|---|---|
| Sreet name | Count |
| PLANK RD | 204 |
| SAMUELS RD | 110 |
| MAIN ST | 106 |
| FLONACHER RD | 100 |
| HWY 19 HW | 88 |
| OLD SCENIC HW | 86 |
| PRIDE PORT HUDSON RD | 80 |
| MOUNT PLEASANT RD | 78 |
| HWY 19 | 74 |
| OLD SCENIC | 64 |
| JACKSON RD | 60 |
| BARNETT RD | 56 |
| LOWER ZACHARY RD | 56 |
| REAMES RD | 52 |
| CHURCH ST | 48 |
| HECK YOUNG RD | 48 |
| LEMON RD | 44 |
| MILLDALE RD | 40 |
| HWY 61 HW | 38 |
| JOOR RD | 38 |
| BLACKWATER RD | 34 |
| TUCKER RD | 34 |
| LIGON RD | 32 |
| ARLEEN AVE | 30 |
| HUNT RD | 30 |
| PEAIRS RD | 30 |
| PORT HUDSONPLAINS RD | 30 |
| HWY 61 | 28 |
| OLD BAKER RD | 28 |
| ROLLINS RD | 28 |
| Other | 182 |
2002 - 2018 National Fire Incident Reporting System (NFIRS) incidents
- Incident types reported to NFIRS in Zachary, LA
- 8,21050.8%Rescue & EMS
- 2,16113.4%Service Call
- 2,11013.1%Good Intent Call
- 1,95612.1%Fire
- 9345.8%Hazardous Condition
- 7104.4%False Alarm
- 330.2%Special Incident
- 320.2%Severe Weather
- Fire incident types reported to NFIRS in Zachary, LA
- 98950.6%Outside Fires
- 61131.2%Structure Fires
- 29715.2%Mobile Property/Vehicle Fires
- 593.0%Other
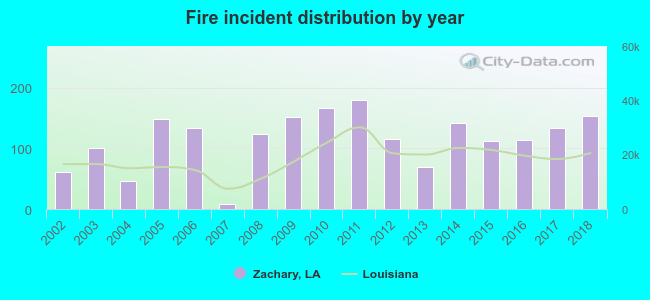 According to the data from the years 2002 - 2018 the average number of fire incidents per year is 115. The highest number of reported fire incidents - 179 took place in 2011, and the least - 8 in 2007. The data has a growing trend.
The average number of yearly fire incidents per 10k residents in Zachary, LA compared to nearest cities:
(Note: Based on data for the last 3 years, including only cities with population 5,000 and above)
| Zachary: | 82.4 |
| Baker: | 59.3 |
| Monticello: | 1.9 |
| Baton Rouge: | 60.1 |
| Port Allen: | 77.8 |
| Denham Springs: | 383.0 |
| Walker: | 191.8 |
| Plaquemine: | 100.1 |
| Prairieville: | 53.8 |
 The median response time based on all reported fire incidents is 6 minutes. This is about the same as the Louisiana median value.
The median response time in Zachary, LA compared to nearest cities:
(Note: Based on data for all years, including only cities with at least 500 fire incidents)
| Zachary: | 6 minutes |
| Baker: | 5 minutes |
| Baton Rouge: | 4 minutes |
| Port Allen: | 5 minutes |
| Denham Springs: | 7 minutes |
| Walker: | 8 minutes |
| Plaquemine: | 5 minutes |
| Livingston: | 9 minutes |
| Prairieville: | 6 minutes |
 Based on the reports from the years 2002 - 2018 the average number of fire-related fatalities per year is 0. The highest number of deaths - 3 took place in 2018, and the lowest - 0 in 2002. The data has an increasing trend.
 Based on the reports from the years 2002 - 2018 the average number of fire-related casualties per year is 1. The highest number of reported casualties - 3 took place in 2013, and the lowest - 0 in 2006. The data has a decreasing trend.
The average number of casualties per 1,000 fire incidents is 10. This indicator was the highest - 43 in 2004, and the lowest 0 in 2006. The trend for casualties per 1,000 fires is declining. Compared to the state value the number of injuries per 1,000 fires is higher.
Based on the reports from the years 2002 - 2018 the average number of fire-related casualties per year is 1. The highest number of reported casualties - 3 took place in 2013, and the lowest - 0 in 2006. The data has a decreasing trend.
The average number of casualties per 1,000 fire incidents is 10. This indicator was the highest - 43 in 2004, and the lowest 0 in 2006. The trend for casualties per 1,000 fires is declining. Compared to the state value the number of injuries per 1,000 fires is higher.Casualties per 1,000 incidents in Zachary, LA compared to nearest cities:
(Note: Based on data for all years, including only cities with at least 500 fire incidents)
| Zachary: | 7.7 |
| Baker: | 9.0 |
| Baton Rouge: | 6.4 |
| Port Allen: | 21.7 |
| Denham Springs: | 15.1 |
| Walker: | 6.4 |
| Plaquemine: | 3.0 |
| Livingston: | 1.5 |
| Prairieville: | 3.1 |
 27.6% incidents where reported in the morning and 72.4% in the evening. The most fires (16.6%) took place on Saturday, and the least (12.9%) on Tuesday.
 Based on the 1,956 fire incident reports from years 2002 - 2018 most fires (11.1%) took place during March, and the least (6.7%) in April.
 Out of all 16,155 cases reported during the years 2002 - 2018, the most belonged to the categories: Rescue & EMS (50.8%), Service Call (13.4%), and Good Intent Call (13.1%).
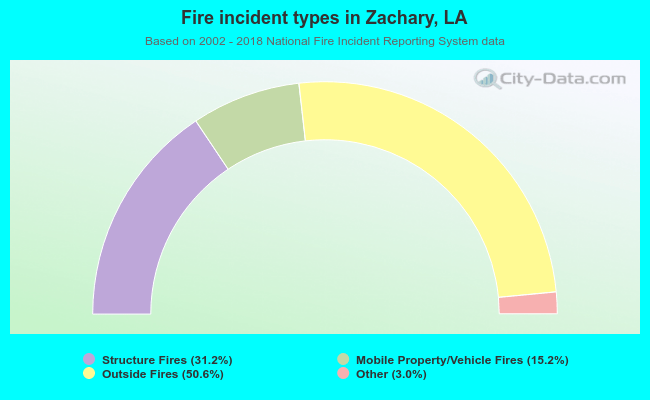 When looking into fire subcategories, the most reports belonged to: Outside Fires (50.6%), and Structure Fires (31.2%).