Please register to participate in our discussions with 2 million other members - it's free and quick! Some forums can only be seen by registered members. After you create your account, you'll be able to customize options and access all our 15,000 new posts/day with fewer ads.
I was waiting for him clutch his chest if he got much more worked up. I think that is how some of us feel more recently with the way the season has been so far. Can't really say this is winter since officially that season isn't here yet. Still have a good four months to turn all this around. I'd go out and do a snow dance myself, but physically I won't do that or I'd be laying there in the snow until someone came along and poked me with a stick to see if I was still alive.
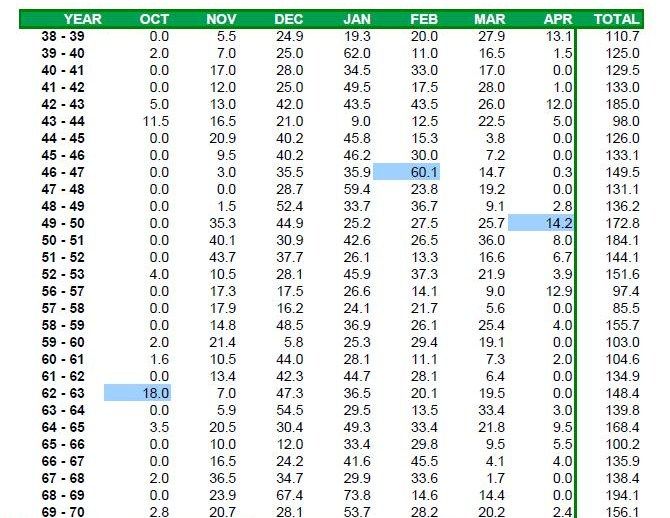
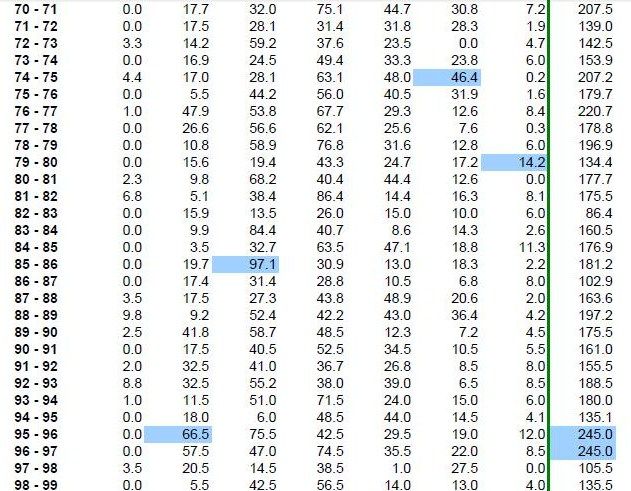
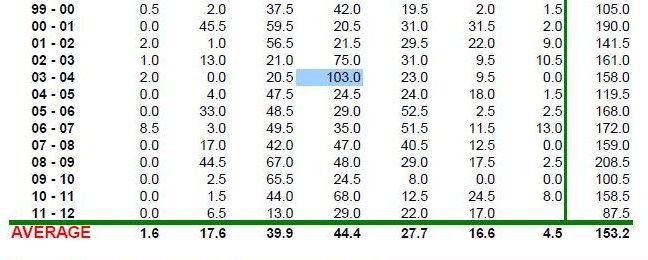
I pulled our county snowfall totals going back to the Winter of 1938 to current. It's monthly snow totals for October thru April. What is highlighted blue are the record holders of each month. I had to cut it into three separate shots, sorry about that.
Nice video. This is an interesting piece I found from AmericanWx. (from user Isotherm, Source)
Quote:
Posted this in the main board but I'll add it here as well.
Wanted to make a post addressing some recent comments/concerns about the surge positive in NAO/AO that's possible over the next 7-10 days, namely it's potential ramifications for down the road.
I did some research, looking back at daily NAO/AO fluctuations, and interestingly enough, my top analog for this winter (1968-69) had similar behaviour NAO/AO wise throughout the autumn.
NAO/AO values plummeted in October/early November w/ numbers as low as -3 SD. However, by late November, daily NAO readngs went positive, and the AO reached a peak of +1.7 SD on December 3rd 1968.
As a result, the following H5 pattern developed in the last week of Nov through early December 1968.
Looks like a terrible pattern across the northern latitudes, right? That's because it is a terrible pattern. Low heights dominating from AK eastward to Greenland and in the Arctic as well. For that period, a significant pattern relaxation occurred, and in turn, sfc temps responded mild in much of sern Canada and the US for the first week of December 1968:
Not an all out blowtorch pattern, but certainly biased warmer than normal for the early portion of December. We might see a similar outcome here, with a bit more warmth.
Moving onward, the global regime changed dramatically post December 10th, and the H5 pattern for Dec 10-30th 1968 looked like this:
Is this the same winter?
AO values went from near +2 in early December, to near neutral by December 15th, then in the tank around Christmas, near -4.5 SD. Thus the monthly AO value of slightly negative for DEC 1968 does not tell the whole story of the progression of the month. NAO readings went slightly negative, but nothing crazy, for the remainder of December.
The temperature change at the surface was also impressive for the Dec 10-30th period 1968:
Note the major cold over NW Canada that we've already seen show up in NOV 2012. The source region was not too dissimilar back in 1968. The Canadian cold began making attacks into the nern tier by the middle of December, and the East Coast shared in some of the cold fun by the second half of December.
As far as snowfall, that's not what this post is about, but let's see if the 1968-69 pattern analogged here will hold merit. The 2012 pattern will obviously not evolve in an identical way - the timing could be slightly different, but the idea of a pattern break w/ +NAO/AO period for a couple weeks is not uncommon. The turn positive in the indices does not necessarily mean it's game over - quite the contrary. This is in fact a transitional period of the year, and part of the reason we're seeing such extreme run to run model variance is due to all the re-shuffling that's occuring at H5 across the northern hemisphere. Time will tell if 2012 follows a similar route to 1968, or maybe not. But the point is, the pattern looking unfavorable for the next couple weeks is not reason to worry about the winter as a whole going down the tubes or even writing off the rest of December.
Nice video. This is an interesting piece I found from AmericanWx. (from user Isotherm, Source)
As I always say...who knows what the weather will do (it does what it pleases - lol).
However, based on the newst update - there is a growing chance that December, the first month of meterological winter 2012/2013 will be much above normal. I just saw in Brett Andersons blog that he updated his interpration of the ECMF - now to the end of December. WHile he agreed that the first and maybe the 2bd week of December would see above normal warmth and little truly cold weather - he thought (as did others) that a cold cold shot would come down into the USA by week 3 and/or 4. Now he's has even pushed that off the table: He writes"
I see that the model has backed off on the cold in the East, which is likely due to the fact that the idea of a blocking pattern setting up across Greenland from last week is now less likely, at least according to this particular model run. The above idea may indeed have some merit as there is still no indication of any stratospheric warming events starting up in the far north, which can signal a sustained blocking pattern a few weeks down the road"
Snowing out lightly. Sticking, too for the first time of the season. Most of the ground is covered.
Please register to post and access all features of our very popular forum. It is free and quick. Over $68,000 in prizes has already been given out to active posters on our forum. Additional giveaways are planned.
Detailed information about all U.S. cities, counties, and zip codes on our site: City-data.com.

 Please register to participate in our discussions with 2 million other members - it's free and quick! Some forums can only be seen by registered members. After you create your account, you'll be able to customize options and access all our 15,000 new posts/day with fewer ads.


 What a month.