Please register to participate in our discussions with 2 million other members - it's free and quick! Some forums can only be seen by registered members. After you create your account, you'll be able to customize options and access all our 15,000 new posts/day with fewer ads.
Not sure if they count because CP is a kilometre higher than Cooma in elevation. So it's clear that elevation contributes to their precipitation rather than rain shadow.
Oh, I suppose so..... but then again...."Cooma has an oceanic climate (Cfb); however, it is warmer than would be expected for its altitude and latitude due to being on the leeward (eastern) side of the ranges; this is evident when compared to Batlow on the windward (western) side of the ranges, which averages 3 °C cooler in winter maxima. Summers are warm with cool nights, and winters are chilly with freezing nighttime lows. The area is relatively dry (by south-east coastal Australia standards), as it falls in a rain shadow. Despite its dryness, it only has 90.1 clear days annually, lower than the adjacent coastal areas of Wollongong and Sydney (106 and 107 clear days, respectively).[22][23]
Strong cold fronts often push through the region in winter and snow is not uncommon in Cooma from June to August, however is generally light and rarely settles for more than 24 hours (due to the foehn effect brought about by its eastern location). Severe thunderstorms are semi-frequent in summer and due to the towns elevation can carry large quantities of hail.[24]{"
How about Western Victoria ( Australia ) ?
Halls Gap ( 257m asl ) Mean rainfall 978.8mm.
Then drive 25 klm east to Stawell ( 235m asl ) Mean rainfall 469.1mm.
It would seem that Stawell is shadowed by the Grampians Ranges due west. The highest peak, Mt William, ( 1167m asl ), 30 klm from Stawell, gets 1155.2mm per annum.
Most of the rainfall in this region results from frontal systems travelling West to East
Woohlpooer and Cherrypool on the eastern side ( windward side ) of the Ranges and around 250m asl receive 600mm-700mm per annum, whereas Stawell and Ararat on the leeward side receive 450mm-550mm per annum.
Cape Town has a complex geography and so has some quite interesting small scale rainfall gradients.
The usual climate stats for the city are taken from Cape Town International Airport, on a low lying plain. Its climate is solidly Cs in rainfall with six months (Oct-March) having 30 mm or less by the 1961-90 averages. Driest month is Nov (14 mm) and wettest June (93 mm) and an annual total of 515 mm.
About 18 km to the west and within the city limits, Oranjekloof got 1227 mm per year for the 1928-70 period, with a driest month Feb (35 mm) and wettest months June and July both with 190 mm. That would make it a Cfb climate.
Not sure if this is a rain shadow or Oranjekloof simply catching more rain as it is on the side of the mountain.
It's a bit unrelated to the thread, but I found this really cool take on Reddit which shows how close these drastic climate differences can exist in relation to one another - you can even stand between them!
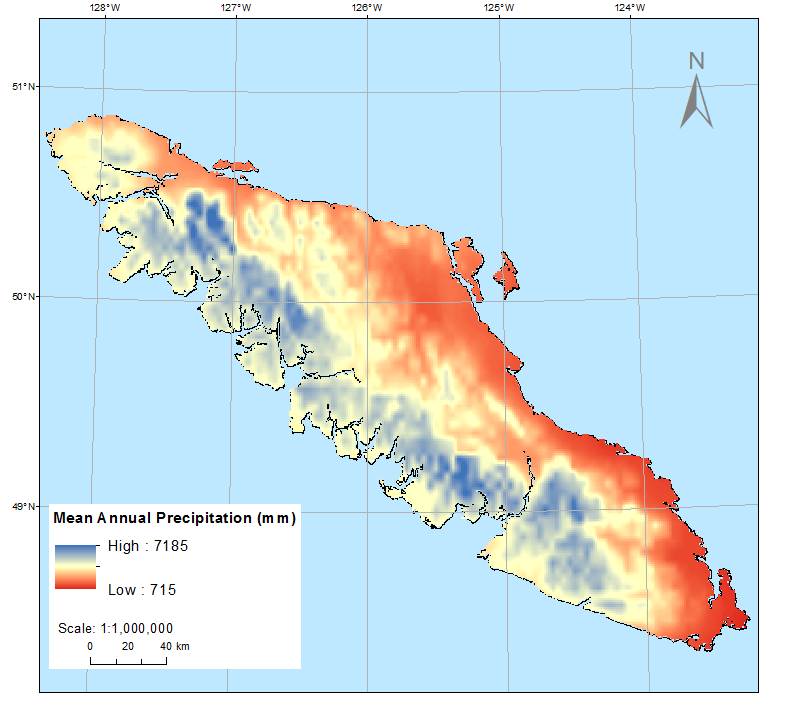
I found this nice map of Vancouver Island rainfall. Knowing that the prevailing wind is SW, it looks like there could be some places 20 km apart where the annual rainfall changes by about 5000 mm. That's about 250 mm per km or about 17 inches per mile. I'm still trying to find some specific station data to support this hypothesis.
It's a bit unrelated to the thread, but I found this really cool take on Reddit which shows how close these drastic climate differences can exist in relation to one another - you can even stand between them!
Hulikal in the Indian state of Karnataka has an average rainfall of 8007 mm (315.23 inches) per year while Shimoga 64 km (39.76 miles) to the east has an average annual rainfall of 731.1 mm (28.78 inches) per year. That's a difference of 113.68 mm (4.47 inches) per km.
I went in Sep-Oct a few years ago, Innisfail and surrounding coastal strip were beautiful and green but as soon as you got up onto the Atherton Tablelands it was looking rather dry.
They provide rain shadow for the craggy areas west of the Tablelands. That region alone has to have the most contrasting rainfall differences (due to rain shadow) in Australia. The precipitation difference between Innisfail and Mareeba is very impressive.
Please register to post and access all features of our very popular forum. It is free and quick. Over $68,000 in prizes has already been given out to active posters on our forum. Additional giveaways are planned.
Detailed information about all U.S. cities, counties, and zip codes on our site: City-data.com.

 Please register to participate in our discussions with 2 million other members - it's free and quick! Some forums can only be seen by registered members. After you create your account, you'll be able to customize options and access all our 15,000 new posts/day with fewer ads.