Alexandria, KY (Kentucky) Houses and Residents
| Alexandria: | $274,169 |
| Kentucky: | $196,300 |
Total population: 8,790 (Urban population: 8,206, Rural population: 19 (all nonfarm))
Houses: 3,953 (3,857 occupied: 3,500 owner occupied, 409 renter occupied)
| % of renters here: | 10% |
| State: | 31% |
Housing density: 734 houses/condos per square mile
Median price asked for vacant for-sale houses and condos in 2022: $1,156,535.
Median contract rent in 2022: $940 (lower quartile is $838, upper quartile is $1,038)
Median rent asked for vacant for-rent units in 2022: $2,519
Median gross rent in Alexandria, KY in 2022: $1,119
Housing units in Alexandria with a mortgage: 2,449 (263 second mortgage, 65 home equity loan, 238 both second mortgage and home equity loan)
Houses without a mortgage: 51
Median household income for houses/condos with a mortgage: $114,624
Median household income for apartments without a mortgage: $80,164
Median monthly housing costs: $1,335
Compare current foreclosures near Alexandria, KY:
| Photo | Address | Area | Beds / Baths | Price | Details |
|---|---|---|---|---|---|

|
#1
Summerlake Dr
Alexandria, KY 41001
|
1,951 sq. feet
|
2 baths 4 beds |
show details | |

|
#2
Michael Dr # 7
Alexandria, KY 41001
|
1,037 sq. feet
|
2 baths 2 beds |
show details | |

|
#3
Sunset Dr
Alexandria, KY 41001
|
1,386 sq. feet
|
2 baths 3 beds |
show details | |

|
#4
Beechwood Ct
Alexandria, KY 41001
|
2,471 sq. feet
|
2 baths 4 beds |
show details | |

|
#5
Brookwood Dr
Alexandria, KY 41001
|
1,924 sq. feet
|
1 baths 3 beds |
show details | |

|
#6
Summerlake Dr
Alexandria, KY 41001
|
2,151 sq. feet
|
2 baths 4 beds |
show details | |

|
#7
Joyce Ann Ln
Alexandria, KY 41001
|
1,092 sq. feet
|
2 baths 3 beds |
show details | |

|
#8
Rose Dr
Alexandria, KY 41001
|
1,026 sq. feet
|
1 baths - beds |
show details | |

|
#9
Meadowview Dr
Alexandria, KY 41001
|
1,686 sq. feet
|
2 baths - beds |
show details | |

|
#10
Ridgewood Dr
Alexandria, KY 41001
|
- sq. feet
|
- baths - beds |
show details |
| Photo | Address | Area | Beds / Baths | Price | Details |
|---|---|---|---|---|---|

|
#11
Ridge Xing
Alexandria, KY 41001
|
- sq. feet
|
- baths - beds |
show details | |

|
#12
Goldeneye Dr
Alexandria, KY 41001
|
- sq. feet
|
- baths - beds |
show details | |

|
#13
Smith Hiteman Rd
Alexandria, KY 41001
|
3,367 sq. feet
|
- baths - beds |
show details | |

|
#14
Fernwood Ct
Alexandria, KY 41001
|
1,640 sq. feet
|
- baths - beds |
show details | |

|
#15
Alexandria Pike
Alexandria, KY 41001
|
1,731 sq. feet
|
- baths - beds |
show details | |

|
#16
Kenton Station Rd
Alexandria, KY 41001
|
1,437 sq. feet
|
- baths - beds |
show details | |

|
#17
Brandywine Ct
Alexandria, KY 41001
|
2,230 sq. feet
|
- baths - beds |
show details | |

|
#18
Rose Dr
Alexandria, KY 41001
|
950 sq. feet
|
- baths - beds |
show details | |

|
#19
Spillman Dr
Alexandria, KY 41001
|
- sq. feet
|
- baths - beds |
show details | |

|
#20
Man O War Cir
Alexandria, KY 41001
|
1,120 sq. feet
|
- baths - beds |
show details |
| Photo | Address | Area | Beds / Baths | Price | Details |
|---|---|---|---|---|---|

|
#21
Lake Circle Dr
Alexandria, KY 41001
|
- sq. feet
|
- baths - beds |
show details | |

|
#22
Constable Dr
Alexandria, KY 41001
|
- sq. feet
|
- baths - beds |
show details | |

|
#23
Pleasant Ridge Rd
Alexandria, KY 41001
|
2,934 sq. feet
|
- baths - beds |
show details | |

|
#24
Darlington Creek Rd
Alexandria, KY 41001
|
- sq. feet
|
- baths - beds |
show details | |

|
#25
Creektrace Rd
Alexandria, KY 41001
|
- sq. feet
|
- baths - beds |
show details | |

|
#26
Moreland Rd
Alexandria, KY 41001
|
9,600 sq. feet
|
- baths - beds |
show details | |

|
#27
Rosemont Ave
Cincinnati, OH 45205
|
1,945 sq. feet
|
1 baths 2 beds |
show details | |

|
#28
Quebec Rd
Cincinnati, OH 45214
|
1,348 sq. feet
|
1 baths 2 beds |
show details | |

|
#29
Wesley Ave
Cincinnati, OH 45212
|
1,986 sq. feet
|
1 baths 3 beds |
show details | |

|
#30
Bluegrass Ave
Newport, KY 41071
|
936 sq. feet
|
1 baths 2 beds |
show details |
| Photo | Address | Area | Beds / Baths | Price | Details |
|---|---|---|---|---|---|

|
#31
Towerview Ln
Cincinnati, OH 45255
|
1,685 sq. feet
|
1 baths 2 beds |
show details | |

|
#32
Iowa Ave
Latonia, KY 41015
|
1,599 sq. feet
|
1 baths 2 beds |
show details | |

|
#33
Missouri Ave
Cincinnati, OH 45226
|
1,551 sq. feet
|
3 baths 3 beds |
show details | |

|
#34
Kenoak Ln
Cincinnati, OH 45213
|
1,221 sq. feet
|
1 baths 4 beds |
show details | |

|
#35
Fisk Ave
Cincinnati, OH 45205
|
1,353 sq. feet
|
2 baths 3 beds |
show details | |

|
#36
Clanora Dr
Cincinnati, OH 45205
|
1,560 sq. feet
|
2 baths 4 beds |
show details | |

|
#37
E Mitchell Ave
Cincinnati, OH 45229
|
2,249 sq. feet
|
2 baths 5 beds |
show details | |

|
#38
Madison Ave
Latonia, KY 41015
|
902 sq. feet
|
1 baths 1 beds |
show details | |

|
#39
Northport Dr
Cincinnati, OH 45255
|
1,800 sq. feet
|
3 baths 3 beds |
show details | |

|
#40
Foxdale Ct
Cincinnati, OH 45243
|
1,368 sq. feet
|
3 baths 4 beds |
show details |
| Photo | Address | Area | Beds / Baths | Price | Details |
|---|---|---|---|---|---|

|
#41
Charingcross Ct
Cincinnati, OH 45238
|
1,755 sq. feet
|
2 baths 3 beds |
show details | |

|
#42
Carthage Ave
Cincinnati, OH 45212
|
1,406 sq. feet
|
1 baths 2 beds |
show details | |

|
#43
Saturn St
Cincinnati, OH 45214
|
1,574 sq. feet
|
2 baths 3 beds |
show details | |

|
#44
Wolfangel Rd
Cincinnati, OH 45255
|
1,740 sq. feet
|
2 baths 3 beds |
show details | |

|
#45
Rosemont Ave
Cincinnati, OH 45205
|
1,062 sq. feet
|
1 baths 2 beds |
show details | |

|
#46
N Fred Shuttlesworth Cir
Cincinnati, OH 45229
|
2,891 sq. feet
|
2 baths 4 beds |
show details | |

|
#47
Corbly Rd Apt 21
Cincinnati, OH 45230
|
930 sq. feet
|
2 baths 2 beds |
show details | |

|
#48
Minion Ave
Cincinnati, OH 45205
|
1,217 sq. feet
|
1 baths 2 beds |
show details | |

|
#49
Orchard Ln
Amelia, OH 45102
|
2,212 sq. feet
|
1 baths 4 beds |
show details | |

|
Check over 1 million property listings on Foreclosure.com!
|
browse all offers | |||

Latest news about housing in Alexandria, KY collected exclusively by city-data.com from local newspapers, TV, and radio stations

 | Relocating to condo/townhouse rental in northern Kentucky (CVG area) (4 replies) |
| Advice needed on Apartments (18 replies) |
| Apartments in NKY (Cold Spring, Alexandria, Ft. Thomas) (5 replies) |
| James Lane Allen Elementary/ Gardenside Homes (3 replies) |
| A nice town to live in Northern KY neat OH border (3 replies) |
| House on Bennett Ave and Versailles Rd (14 replies) |

Median year apartment built: 1984
Household type by relationship:
Households: 10,341- Male householders: 2,024 (282 living alone), Female householders: 1,779 (513 living alone)
2,229 spouses (2,205 opposite-sex spouses), 259 unmarried partners, (259 opposite-sex unmarried partners), 2,878 children (2,511 natural, 82 adopted, 284 stepchildren), 476 grandchildren, 0 brothers or sisters, 190 parents, 22 foster children, 279 other relatives, 175 non-relatives
- In group quarters: 26
Size of family households: 1,130 2-persons, 440 3-persons, 774 4-persons, 178 5-persons, 156 6-persons, 49 7-or-more-persons.
Size of nonfamily households: 862 1-person, 150 2-persons, 39 4-persons.
1,619 married couples with children.
529 single-parent households (313 men, 216 women).
95.3% of residents of Alexandria speak English at home.
0.6% of residents speak Spanish at home (42% speak English very well, 33% speak English well, 25% speak English not well).
2.4% of residents speak other Indo-European language at home (35% speak English very well, 16% speak English well, 47% speak English not well, 2% don't speak English at all).
1.6% of residents speak Asian or Pacific Island language at home (48% speak English very well, 52% speak English well).
Foreign born population: 523 (5.1%)
(25.6% of them are naturalized citizens)
| Here: | 7.0 |
| State: | 6.4 |
| Here: | 3.7 |
| State: | 4.4 |

- Bedrooms in owner-occupied houses and condos in Alexandria, Kentucky
- 10no bedroom
- 181 bedroom
- 3092 bedrooms
- 1,8713 bedrooms
- 1,0434 bedrooms
- 2495+ bedrooms

- Bedrooms in renter-occupied apartments in Alexandria, Kentucky
- 0no bedroom
- 1461 bedroom
- 2122 bedrooms
- 333 bedrooms
- 84 bedrooms
- 105+ bedrooms

- Cars and other vehicles available in Alexandria in owner-occupied houses/condos
- 96no vehicle
- 6311 vehicle
- 1,4402 vehicles
- 7593 vehicles
- 4824 vehicles
- 935+ vehicles

- Cars and other vehicles available in Alexandria in renter-occupied apartments
- 49no vehicle
- 1911 vehicle
- 1422 vehicles
- 283 vehicles
- 04 vehicles
- 05+ vehicles

- Rooms in owner-occupied houses in Alexandria, Kentucky
- 101 room
- 02 rooms
- 483 rooms
- 2194 rooms
- 4035 rooms
- 5726 rooms
- 8237 rooms
- 5538 rooms
- 8729+ rooms

- Rooms in renter-occupied apartments in Alexandria, Kentucky
- 01 room
- 722 rooms
- 1273 rooms
- 784 rooms
- 725 rooms
- 186 rooms
- 77 rooms
- 08 rooms
- 369+ rooms


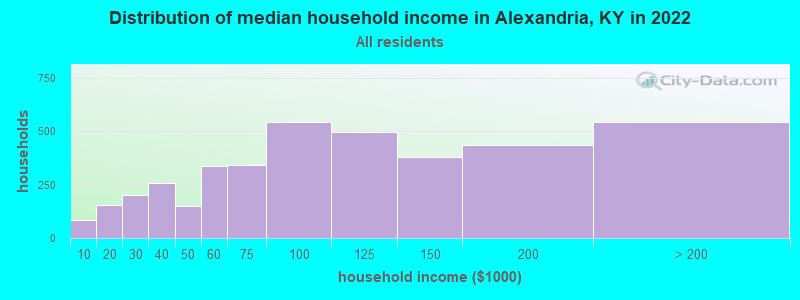
Alexandria, KY household income distribution

- 86Less than $10,000
- 154$10,000 to $19,999
- 204$20,000 to $29,999
- 260$30,000 to $39,999
- 148$40,000 to $49,999
- 336$50,000 to $59,999
- 343$60,000 to $74,999
- 543$75,000 to $99,999
- 499$100,000 to $124,999
- 381$125,000 to $149,999
- 435$150,000 to $199,999
- 544$200,000 or more
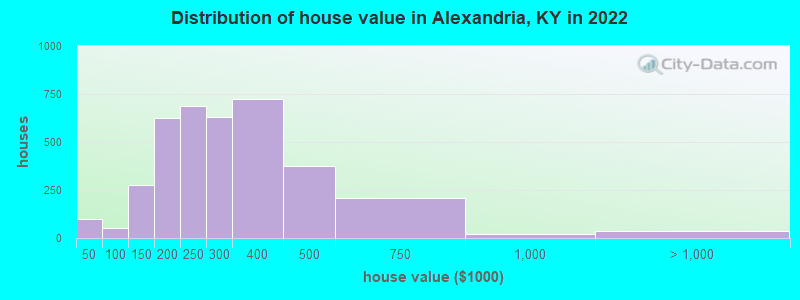
Home value of owner - occupied houses in 2022 in Alexandria, KY
-
- 13Less than $10,000
- 78$20,000 to $24,999
- 8$30,000 to $34,999
- 15$50,000 to $59,999
- 13$70,000 to $79,999
- 22$90,000 to $99,999
- 66$100,000 to $124,999
- 211$125,000 to $149,999
- 364$150,000 to $174,999
- 258$175,000 to $199,999
- 687$200,000 to $249,999
- 627$250,000 to $299,999
- 725$300,000 to $399,999
- 376$400,000 to $499,999
- 206$500,000 to $749,999
- 19$750,000 to $999,999
- 23$1,500,000 to $1,999,999
- 15$2,000,000 or more
Rent paid by renters in 2022 in Alexandria, KY
-
- 17$350 to $399
- 3$550 to $599
- 15$600 to $649
- 31$650 to $699
- 30$700 to $749
- 37$750 to $799
- 88$800 to $899
- 84$900 to $999
- 19$1,000 to $1,249
- 10$1,250 to $1,499
- 18$1,500 to $1,999
- 42No cash rent


Percentage of workers working in this county: 48.7%
Number of people working at home: 907 (15.6% of all workers)
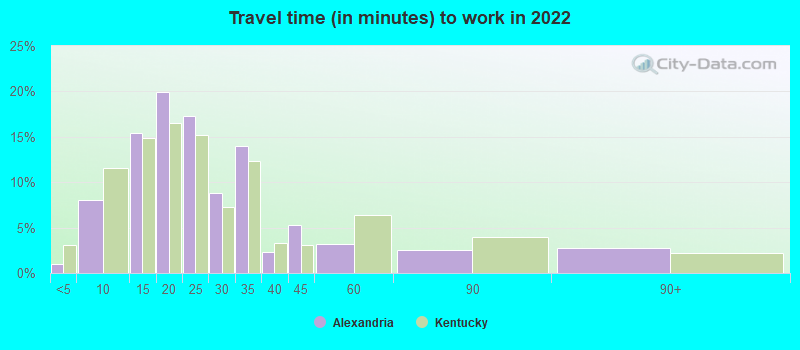
Travel time to work (commute)
- Less than 5 minutes: 79
- 5 to 9 minutes: 251
- 10 to 14 minutes: 516
- 15 to 19 minutes: 328
- 20 to 24 minutes: 587
- 25 to 29 minutes: 913
- 30 to 34 minutes: 1,074
- 35 to 39 minutes: 471
- 40 to 44 minutes: 211
- 45 to 59 minutes: 202
- 60 to 89 minutes: 120
- 90 or more minutes: 105
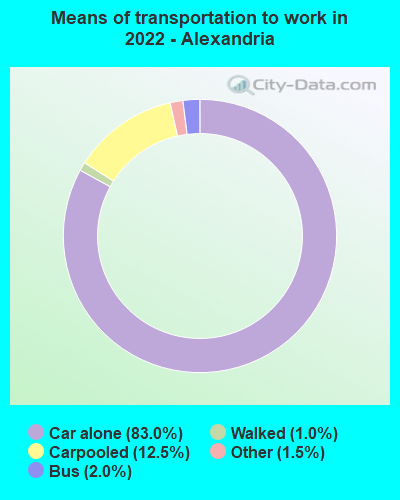
Means of transportation to work:
- Drove a car alone: 2,026 (62.9%)
- Carpooled: 337 (10.5%)
- Bus: 30 (0.9%)
- Taxi: 44 (1.4%)
- Walked: 24 (0.7%)
- Worked at home: 907 (28.2%)

- Unemployment by race in 2022
- Unemployment rate for White non-Hispanic residents
- 3.5%Males
- 1.2%Females

- Year of entry for the foreign-born population in Alexandria, Kentucky
- 1302010 or later
- 1312000 to 2009
- 621990 to 1999
- 171980 to 1989
- 131970 to 1979
- 51Before 1970
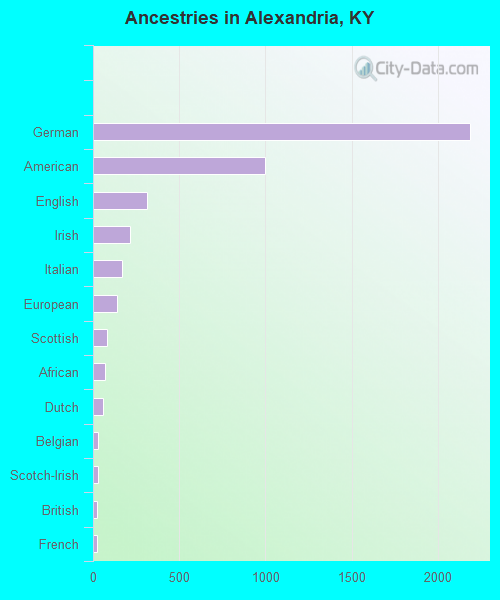
First ancestries reported:
- German: 2,187 (38.4%)
- American: 998 (17.5%)
- English: 315 (5.5%)
- Irish: 215 (3.8%)
- Italian: 170 (3.0%)
- European: 141 (2.5%)
- Scottish: 82 (1.4%)
- African: 70 (1.2%)
- Dutch: 59 (1.0%)
- Belgian: 27 (0.5%)
- Scotch-Irish: 27 (0.5%)
- British: 21 (0.4%)
- French: 21 (0.4%)
- Portuguese: 17 (0.3%)
- Polish: 16 (0.3%)
- Australian: 15 (0.3%)
- Lebanese: 13 (0.2%)
- Welsh: 10 (0.2%)
- Croatian: 7 (0.1%)
- Jamaican: 7 (0.1%)
Most common places of birth for foreign-born residents (%):
| Alexandria: | 69.5% (276) |
| Kentucky: | 7.3% (13,454) |
| Alexandria: | 13.1% (52) |
| Kentucky: | 2.9% (5,302) |
| Alexandria: | 8.3% (33) |
| Kentucky: | 0.4% (782) |
| Alexandria: | 5.5% (22) |
| Kentucky: | 0.4% (723) |
| Alexandria: | 1.8% (7) |
| Kentucky: | 0.8% (1,437) |
| Alexandria: | 1.5% (6) |
| Kentucky: | 0.2% (301) |
Place of birth for U.S.-born residents:
- This state: 6,389
- Other state: 3,426
- Northeast: 269
- Midwest: 2,581
- South: 326
- West: 283
87.0% of Alexandria residents lived in the same house 1 years ago.
Out of people who lived in different houses, 36.0% lived in this county.
Out of people who lived in different counties, 67.9% lived in Kentucky.
| Alexandria: | 87.0% |
| State average: | 87.2% |
Education attainment for males 25 years and older:
- No schooling: 13
- Nursery to 4th grade: 0
- 5th and 6th grade: 0
- 7th and 8th grade: 48
- 9th grade: 0
- 10th grade: 44
- 11th grade: 12
- 12th grade, no diploma: 63
- High school graduate (or equivalency): 1,015
- Less than 1 year of college: 290
- Some college more than 1 year, no degree: 465
- Associate degree: 281
- Bachelor's degree: 808
- Master's degree: 305
- Professional school degree: 79
- Doctorate degree: 39

Education attainment for females 25 years and older:
- No schooling: 10
- Nursery to 4th grade: 16
- 5th and 6th grade: 0
- 7th and 8th grade: 94
- 9th grade: 32
- 10th grade: 34
- 11th grade: 0
- 12th grade, no diploma: 51
- High school graduate (or equivalency): 940
- Less than 1 year of college: 318
- Some college more than 1 year, no degree: 407
- Associate degree: 387
- Bachelor's degree: 704
- Master's degree: 480
- Professional school degree: 35
- Doctorate degree: 26


Housing units in structures:
- One, detached: 3,379
- One, attached: 220
- 5 to 9: 131
- 10 to 19: 162
- 20 to 49: 21
- Mobile homes: 38
Housing units lacking complete kitchen facilities in 2022: 0.4%
House/condo owner moved in on average 8 years ago
Renter moved in on average 0 years ago

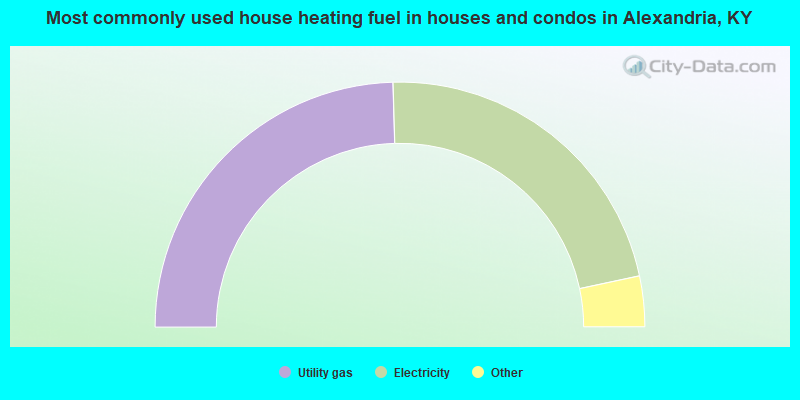
- 49.1%Utility gas
- 44.2%Electricity
- 3.0%Wood
- 3.0%Bottled, tank, or LP gas
- 0.4%Other fuel
- 0.3%No fuel used
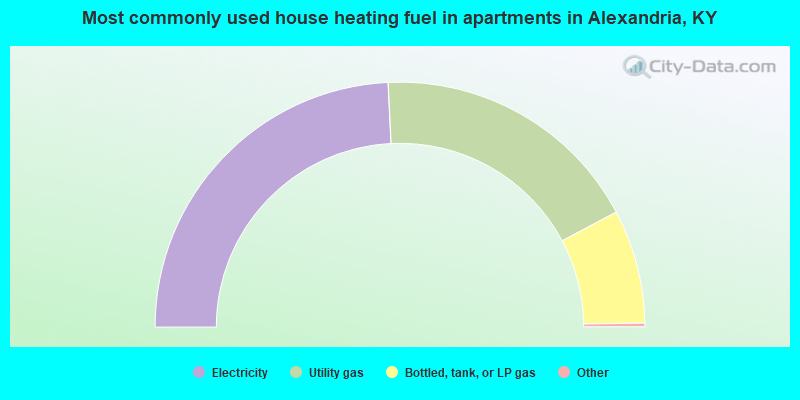
- 48.7%Electricity
- 36.2%Utility gas
- 15.1%Bottled, tank, or LP gas
Private vs. public school enrollment:
| Here: | 13.1% |
| Kentucky: | 17.2% |
| Here: | 14.5% |
| Kentucky: | 15.2% |
| Here: | 1.5% |
| Kentucky: | 19.6% |


