Algonquin, IL (Illinois) Houses and Residents
Estimated median house or condo value in 2022: $330,544 (it was $194,500 in 2000 )
Algonquin:
$330,544Illinois:
$251,600
Lower value quartile - upper value quartile: $256,347 - $404,686Mean price in 2022: Detached houses: $345,122 Here:
$345,122State:
$310,164
Townhouses or other attached units: $227,530 Here:
$227,530State:
$286,230
In 2-unit structures: $116,058 Here:
$116,058State:
$299,638
In 3-to-4-unit structures: $222,731 Here:
$222,731State:
$330,907
In 5-or-more-unit structures: $186,152 Here:
$186,152State:
$318,887
Total population: 30,410 (Urban population: 23,419, Rural population: 0)
Houses: 11,203 (11,097 occupied: 9,652 owner occupied, 1,579 renter occupied )
% of renters here:
14%State:
33%
Housing density: 1,139 houses/condos per square mile
Median price asked for vacant for-sale houses and condos in 2022 in this county: $276,011.
Median contract rent in 2022: $1,453 (lower quartile is $975, upper quartile is $1,736)
Median rent asked for vacant for-rent units in 2022: $664
Median gross rent in Algonquin, IL in 2022: $1,661
Housing units in Algonquin with a mortgage: 7,153 (796 second mortgage, 6 home equity loan, 726 both second mortgage and home equity loan )Houses without a mortgage: 185
Median household income for houses/condos with a mortgage: $143,273
Median household income for apartments without a mortgage: $106,282
Median monthly housing costs: $1,808
Data:
Median house or condo value ($)
Median house or condo value ($ change since 2000)
Median house or condo value ($) - White
Median house or condo value ($) - Black or African American
Median house or condo value ($) - Asian
Median house or condo value ($) - Hispanic or Latino
Median house or condo value ($) - American Indian and Alaska Native
Median house or condo value ($) - Multirace
Median house or condo value ($) - Other Race
Median price asked for mobile homes ($)
Household density (households per square mile)
Mean house or condo value by units in structure - 1, detached ($)
Mean house or condo value by units in structure - 1, attached ($)
Mean house or condo value by units in structure - 2 ($)
Mean house or condo value by units in structure by units in structure - 3 or 4 ($)
Mean house or condo value by units in structure - 5 or more ($)
Mean house or condo value by units in structure - Boat, RV, van, etc. ($)
Mean house or condo value by units in structure - Mobile home ($)
Median contract rent ($)
Median contract rent - Lower quartile ($)
Median contract rent - Upper quartile ($)
Median gross rent ($)
Urban houses (%)
Rural houses (%)
Houses occupied (%)
Houses occupied (% change since 2000)
Houses owner occupied (%)
Houses owner occupied (% change since 2000)
Houses renter occupied (%)
Houses renter occupied (% change since 2000)
Vacant housing units - For rent (%)
Vacant housing units - For rent (% change since 2000)
Vacant housing units - For sale only (%)
Vacant housing units - For sale only (% change since 2000)
Vacant housing units - Rented or sold, not occupied (%)
Vacant housing units - Rented or sold, not occupied (% change since 2000)
Vacant housing units - For seasonal, recreational, or occasional use (%)
Vacant housing units - For seasonal, recreational, or occasional use (% change since 2000)
Vacant housing units - For migrant workers (%)
Vacant housing units - For migrant workers (% change since 2000)
Vacant housing units - Other vacant (%)
Vacant housing units - Other vacant (% change since 2000)
Median monthly housing costs ($)
Median household income for houses/condos with a mortgage ($)
Median household income for houses/condos without a mortgage ($)
Median household income ($)
Median household income ($) - White
Median household income ($) - Black or African American
Median household income ($) - Asian
Median household income ($) - Hispanic or Latino
Median household income ($) - American Indian and Alaska Native
Median household income ($) - Multirace
Median household income ($) - Other Race
Mortgage status - with mortgage (%)
Mortgage status - with second mortgage (%)
Mortgage status - with home equity loan (%)
Mortgage status - with both second mortgage and home equity loan (%)
Mortgage status - without a mortgage (%)
Median year house/condo built
Median year apartment built
Household type by relationship - Male householder living alone (%)
Household type by relationship - Male householder not living alone (%)
Household type by relationship - Female householder living alone (%)
Household type by relationship - Female householder not living alone (%)
Household type by relationship - Opposite-Sex spouse (%)
Household type by relationship - Same-Sex spouse (%)
Household type by relationship - Opposite-Sex unmarried partner (%)
Household type by relationship - Same-Sex unmarried partner (%)
Household type by relationship - In group quarters (%)
Size of family households - 2-person household (%)
Size of family households - 3-person household (%)
Size of family households - 4-person household (%)
Size of family households - 5-person household (%)
Size of family households - 6-person household (%)
Size of family households - 7-or-more-person household (%)
Size of nonfamily households - 1-person household (%)
Size of nonfamily households - 2-person household (%)
Size of nonfamily households - 3-person household (%)
Size of nonfamily households - 4-person household (%)
Size of nonfamily households - 5-person household (%)
Size of nonfamily households - 6-person household (%)
Size of nonfamily households - 7-or-moreperson household (%)
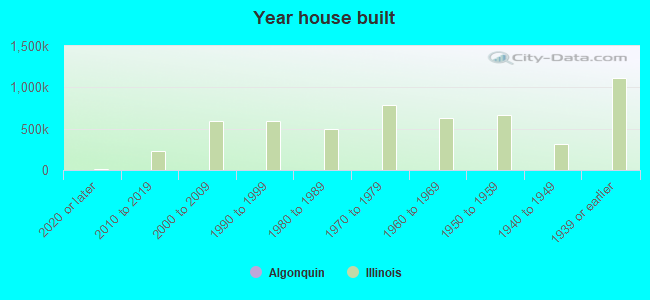
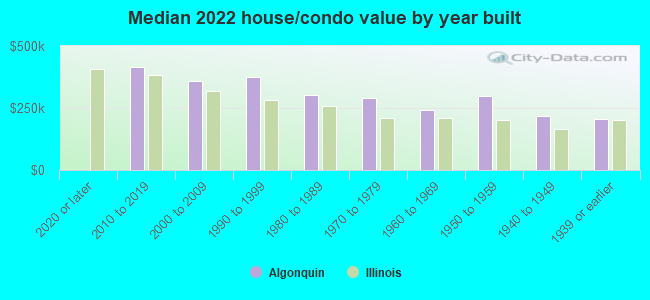
Year house built - Built 2010 or later (%)
Year house built - Built 2000 to 2009 (%)
Year house built - Built 1990 to 1999 (%)
Year house built - Built 1980 to 1989 (%)
Year house built - Built 1970 to 1979 (%)
Year house built - Built 1960 to 1969 (%)
Year house built - Built 1950 to 1959 (%)
Year house built - Built 1940 to 1949 (%)
Year house built - Built 1939 or earlier (%)
Median number of rooms in houses and condos
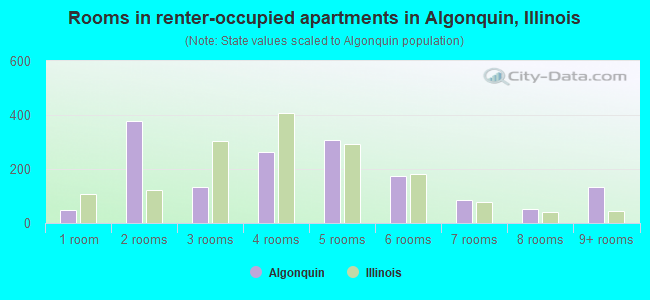
Median number of rooms in apartments
Median number of bedrooms in owner occupied houses
Mean number of bedrooms in owner occupied houses
Median number of bedrooms in renter occupied houses
Mean number of bedrooms in renter occupied houses
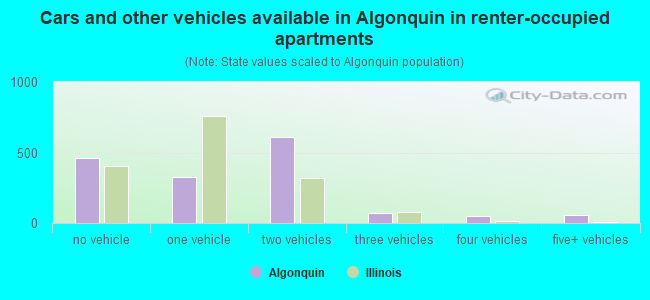
Median number of vehichles in owner occupied houses
Mean number of vehichles in owner occupied houses
Median number of vehichles in renter occupied houses
Mean number of vehichles in renter occupied houses
Rooms in owner-occupied houses - 1 room (%)
Rooms in owner-occupied houses - 2 rooms (%)
Rooms in owner-occupied houses - 3 rooms (%)
Rooms in owner-occupied houses - 4 rooms (%)
Rooms in owner-occupied houses - 5 rooms (%)
Rooms in owner-occupied houses - 6 rooms (%)
Rooms in owner-occupied houses - 7 rooms (%)
Rooms in owner-occupied houses - 8 rooms (%)
Rooms in owner-occupied houses - 9+ rooms (%)
Rooms in renter-occupied houses - 1 room (%)
Rooms in renter-occupied houses - 2 rooms (%)
Rooms in renter-occupied houses - 3 rooms (%)
Rooms in renter-occupied houses - 4 rooms (%)
Rooms in renter-occupied houses - 5 rooms (%)
Rooms in renter-occupied houses - 6 rooms (%)
Rooms in renter-occupied houses - 7 rooms (%)
Rooms in renter-occupied houses - 8 rooms (%)
Rooms in renter-occupied houses - 9+ rooms (%)
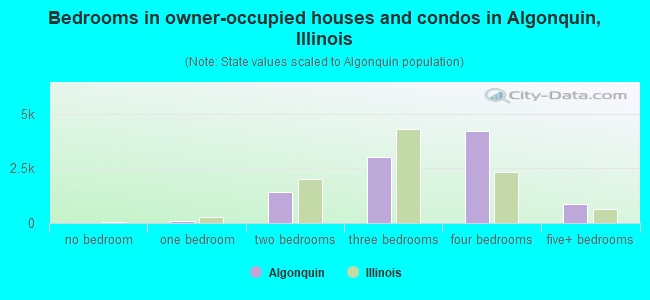
Bedrooms in owner-occupied houses - no bedrooms (%)
Bedrooms in owner-occupied houses - 1 bedroom (%)
Bedrooms in owner-occupied houses - 2 bedrooms (%)
Bedrooms in owner-occupied houses - 3 bedrooms (%)
Bedrooms in owner-occupied houses - 4 bedrooms (%)
Bedrooms in owner-occupied houses - 5+ bedrooms (%)
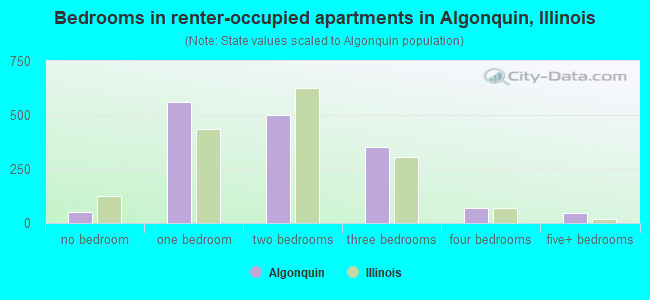
Bedrooms in renter-occupied houses - no bedrooms (%)
Bedrooms in renter-occupied houses - 1 bedroom (%)
Bedrooms in renter-occupied houses - 2 bedrooms (%)
Bedrooms in renter-occupied houses - 3 bedrooms (%)
Bedrooms in renter-occupied houses - 4 bedrooms (%)
Bedrooms in renter-occupied houses - 5+ bedrooms (%)
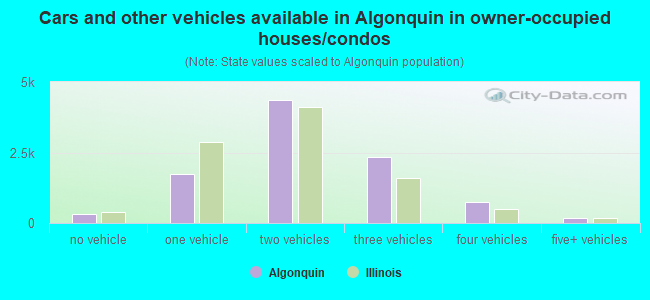
Vehicles available in owner-occupied houses - no vehicle available (%)
Vehicles available in owner-occupied houses - 1 vehicle available(%)
Vehicles available in owner-occupied houses - 2 Vehicles available (%)
Vehicles available in owner-occupied houses - 3 Vehicles available (%)
Vehicles available in owner-occupied houses - 4 Vehicles available (%)
Vehicles available in owner-occupied houses - 5+ Vehicles available (%)
Vehicles available in renter-occupied houses - no vehicle available (%)
Vehicles available in renter-occupied houses - 1 vehicle available (%)
Vehicles available in renter-occupied houses - 2 Vehicles available (%)
Vehicles available in renter-occupied houses - 3 Vehicles available (%)
Vehicles available in renter-occupied houses - 4 Vehicles available (%)
Vehicles available in renter-occupied houses - 5+ Vehicles available (%)
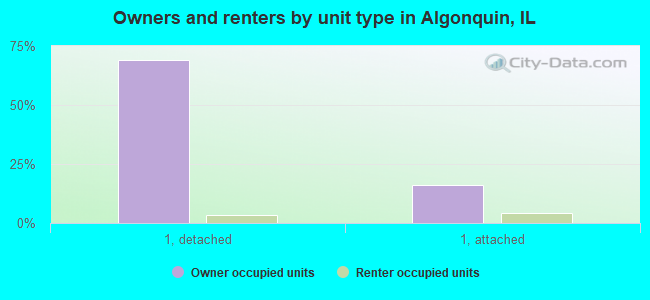
Housing units in structures - 1, detached (%)
Housing units in structures - 1, attached (%)
Housing units in structures - 2 (%)
Housing units in structures - 3 or 4 (%)
Housing units in structures - 5 to 9 (%)
Housing units in structures - 10 to 19 (%)
Housing units in structures - 20 to 49 (%)
Housing units in structures - 50 or more (%)
Housing units in structures - Mobile home (%)
Housing units in structures - Boat, RV, van, etc. (%)
Housing units in structures - Owners - 1, detached (%)
Housing units in structures - Owners - 1, attached (%)
Housing units in structures - Owners - 2 (%)
Housing units in structures - Owners - 3 or 4 (%)
Housing units in structures - Owners - 5 to 9 (%)
Housing units in structures - Owners - 10 to 19 (%)
Housing units in structures - Owners - 20 to 49 (%)
Housing units in structures - Owners - 50 or more (%)
Housing units in structures - Owners - Mobile home (%)
Housing units in structures - Owners - Boat, RV, van, etc. (%)
Housing units in structures - Renters - 1, detached (%)
Housing units in structures - Renters - 1, attached (%)
Housing units in structures - Renters - 2 (%)
Housing units in structures - Renters - 3 or 4 (%)
Housing units in structures - Renters - 5 to 9 (%)
Housing units in structures - Renters - 10 to 19 (%)
Housing units in structures - Renters - 20 to 49 (%)
Housing units in structures - Renters - 50 or more (%)
Housing units in structures - Renters - Mobile home (%)
Housing units in structures - Renters - Boat, RV, van, etc. (%)
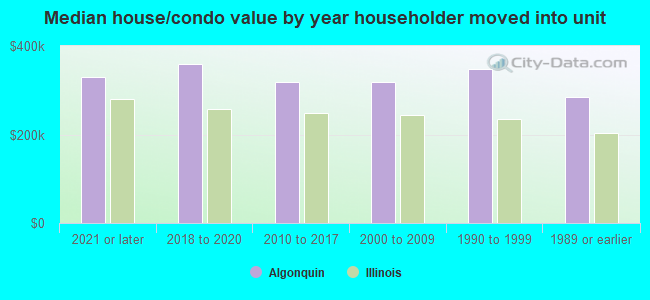
House/condo owner moved in on average (years ago)
Renter moved in on average (years ago)
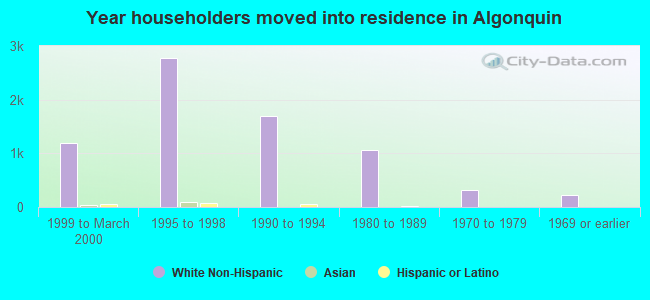
Year householder moved into unit - Moved in 1999 to March 2000 (%)
Year householder moved into unit - Moved in 1999 to March 2000 (%) - White
Year householder moved into unit - Moved in 1999 to March 2000 (%) - Black or African American
Year householder moved into unit - Moved in 1999 to March 2000 (%) - Asian
Year householder moved into unit - Moved in 1999 to March 2000 (%) - Hispanic or Latino
Year householder moved into unit - Moved in 1999 to March 2000 (%) - American Indian and Alaska Native
Year householder moved into unit - Moved in 1999 to March 2000 (%) - Multirace
Year householder moved into unit - Moved in 1999 to March 2000 (%) - Other Race
Year householder moved into unit - Moved in 1995 to 1998 (%)
Year householder moved into unit - Moved in 1995 to 1998 (%) - White
Year householder moved into unit - Moved in 1995 to 1998 (%) - Black or African American
Year householder moved into unit - Moved in 1995 to 1998 (%) - Asian
Year householder moved into unit - Moved in 1995 to 1998 (%) - Hispanic or Latino
Year householder moved into unit - Moved in 1995 to 1998 (%) - American Indian and Alaska Native
Year householder moved into unit - Moved in 1995 to 1998 (%) - Multirace
Year householder moved into unit - Moved in 1995 to 1998 (%) - Other Race
Year householder moved into unit - Moved in 1990 to 1994 (%)
Year householder moved into unit - Moved in 1990 to 1994 (%) - White
Year householder moved into unit - Moved in 1990 to 1994 (%) - Black or African American
Year householder moved into unit - Moved in 1990 to 1994 (%) - Asian
Year householder moved into unit - Moved in 1990 to 1994 (%) - Hispanic or Latino
Year householder moved into unit - Moved in 1990 to 1994 (%) - American Indian and Alaska Native
Year householder moved into unit - Moved in 1990 to 1994 (%) - Multirace
Year householder moved into unit - Moved in 1990 to 1994 (%) - Other Race
Year householder moved into unit - Moved in 1980 to 1989 (%)
Year householder moved into unit - Moved in 1980 to 1989 (%) - White
Year householder moved into unit - Moved in 1980 to 1989 (%) - Black or African American
Year householder moved into unit - Moved in 1980 to 1989 (%) - Asian
Year householder moved into unit - Moved in 1980 to 1989 (%) - Hispanic or Latino
Year householder moved into unit - Moved in 1980 to 1989 (%) - American Indian and Alaska Native
Year householder moved into unit - Moved in 1980 to 1989 (%) - Multirace
Year householder moved into unit - Moved in 1980 to 1989 (%) - Other Race
Year householder moved into unit - Moved in 1970 to 1979 (%)
Year householder moved into unit - Moved in 1970 to 1979 (%) - White
Year householder moved into unit - Moved in 1970 to 1979 (%) - Black or African American
Year householder moved into unit - Moved in 1970 to 1979 (%) - Asian
Year householder moved into unit - Moved in 1970 to 1979 (%) - Hispanic or Latino
Year householder moved into unit - Moved in 1970 to 1979 (%) - American Indian and Alaska Native
Year householder moved into unit - Moved in 1970 to 1979 (%) - Multirace
Year householder moved into unit - Moved in 1970 to 1979 (%) - Other Race
Year householder moved into unit - Moved in 1969 or earlier (%)
Year householder moved into unit - Moved in 1969 or earlier (%) - White
Year householder moved into unit - Moved in 1969 or earlier (%) - Black or African American
Year householder moved into unit - Moved in 1969 or earlier (%) - Asian
Year householder moved into unit - Moved in 1969 or earlier (%) - Hispanic or Latino
Year householder moved into unit - Moved in 1969 or earlier (%) - American Indian and Alaska Native
Year householder moved into unit - Moved in 1969 or earlier (%) - Multirace
Year householder moved into unit - Moved in 1969 or earlier (%) - Other Race
Housing units lacking complete plumbing facilities (%)
Housing units lacking complete kitchen facilities (%)
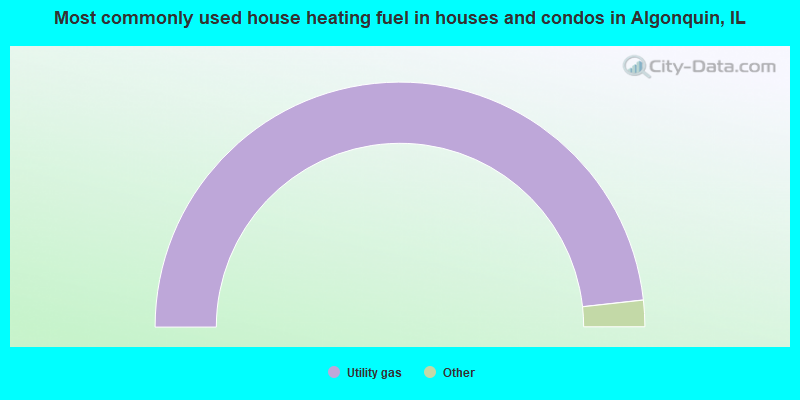
House heating fuel used in houses and condos - Utility gas (%)
House heating fuel used in houses and condos - Bottled, tank, or LP gas (%)
House heating fuel used in houses and condos - Electricity (%)
House heating fuel used in houses and condos - Fuel oil, kerosene, etc. (%)
House heating fuel used in houses and condos - Coal or coke (%)
House heating fuel used in houses and condos - Wood (%)
House heating fuel used in houses and condos - Solar energy (%)
House heating fuel used in houses and condos - Other fuel (%)
House heating fuel used in houses and condos - No fuel used (%)
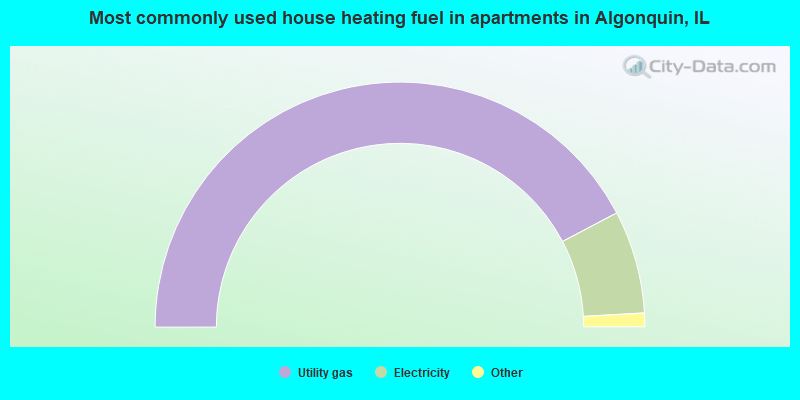
House heating fuel used in apartments - Utility gas (%)
House heating fuel used in apartments - Bottled, tank, or LP gas (%)
House heating fuel used in apartments - Electricity (%)
House heating fuel used in apartments - Fuel oil, kerosene, etc. (%)
House heating fuel used in apartments - Coal or coke (%)
House heating fuel used in apartments - Wood (%)
House heating fuel used in apartments - Solar energy (%)
House heating fuel used in apartments - Other fuel (%)
House heating fuel used in apartments - No fuel used (%)
Latest news about housing in Algonquin, IL collected exclusively by city-data.com from local newspapers, TV, and radio stations
Median year house/condo built: 1993Median year apartment built: 1997Household type by relationship:
Households: 29,946
Male householders: 6,185 (783 living alone ), Female householders: 4,800 (1,170 living alone )6,750 spouses (6,705 opposite-sex spouses ), 1,014 unmarried partners , (936 opposite-sex unmarried partners ), 9,358 children (8,959 natural , 96 adopted , 302 stepchildren ), 411 grandchildren , 23 brothers or sisters , 326 parents , 18 foster children , 430 other relatives , 626 non-relatives In group quarters: 1
Size of family households: 3,175 2-persons , 2,034 3-persons , 1,857 4-persons , 740 5-persons , 247 6-persons .
Size of nonfamily households: 2,247 1-person , 724 2-persons , 4 3-persons , 60 4-persons , 42 6-persons .
4,639 married couples with children. single-parent households (451 men , 461 women ).
80.3% of residents of Algonquin speak English at home. of residents speak Spanish at home (75% speak English very well , 14% speak English well , 9% speak English not well , 2% don't speak English at all ).of residents speak other Indo-European language at home (60% speak English very well , 24% speak English well , 11% speak English not well , 5% don't speak English at all ).of residents speak Asian or Pacific Island language at home (61% speak English very well , 33% speak English well , 6% speak English not well ).of residents speak other language at home (88% speak English very well , 12% speak English well ).
Foreign born population: 3,740 (12.5%)of them are naturalized citizens )
Median number of rooms in houses and condos:
Median number of rooms in apartments
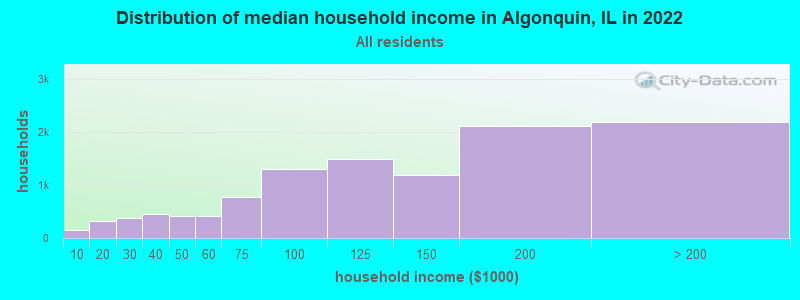
Algonquin, IL household income distribution 143 Less than $10,000323 $10,000 to $19,999383 $20,000 to $29,999445 $30,000 to $39,999406 $40,000 to $49,999413 $50,000 to $59,999764 $60,000 to $74,9991,291 $75,000 to $99,9991,484 $100,000 to $124,9991,192 $125,000 to $149,9992,117 $150,000 to $199,9992,186 $200,000 or more
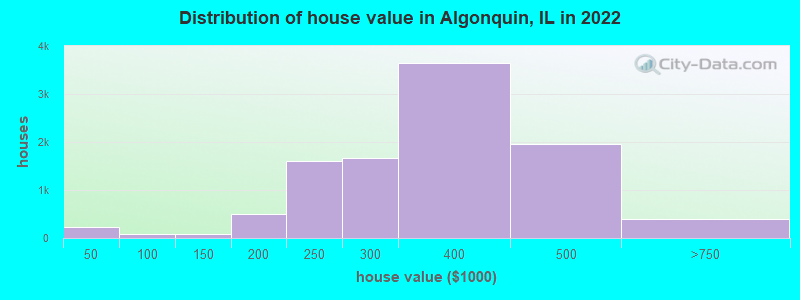
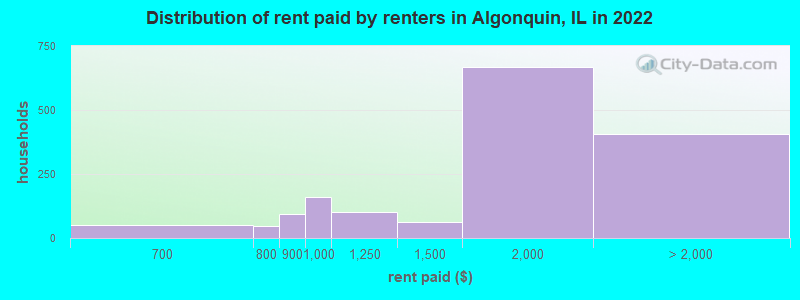
Home value of owner - occupied houses in 2022 in Algonquin, IL 133 Less than $10,0009 $15,000 to $19,99935 $20,000 to $24,99914 $25,000 to $29,99928 $35,000 to $39,9998 $40,000 to $49,99910 $50,000 to $59,99918 $60,000 to $69,99949 $80,000 to $89,9994 $90,000 to $99,99926 $100,000 to $124,99964 $125,000 to $149,999125 $150,000 to $174,999384 $175,000 to $199,9991,609 $200,000 to $249,9991,669 $250,000 to $299,9993,647 $300,000 to $399,9991,959 $400,000 to $499,999382 $500,000 to $749,9996 $1,500,000 to $1,999,999Rent paid by renters in 2022 in Algonquin, IL 48 $600 to $64945 $750 to $79994 $800 to $899162 $900 to $999102 $1,000 to $1,24963 $1,250 to $1,499666 $1,500 to $1,999156 $2,000 to $2,4999 $2,500 to $2,999158 $3,500 or more82 No cash rent
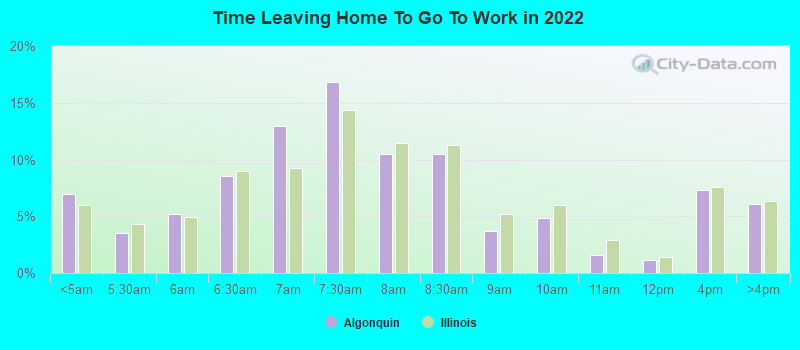
Percentage of workers working in this county: 44.3%Number of people working at home: 3,946 (22.7% of all workers )
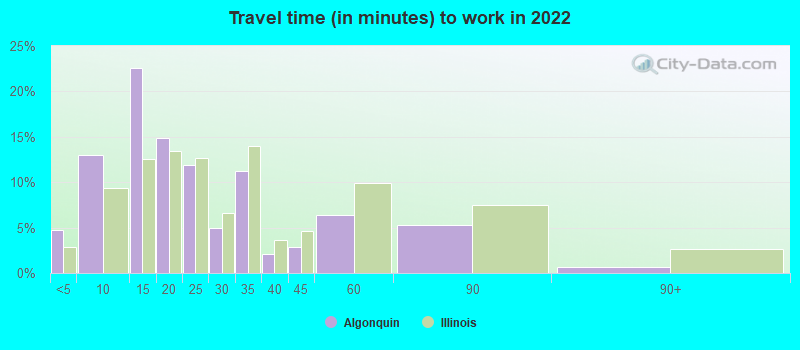
Travel time to work (commute)
Less than 5 minutes: 4515 to 9 minutes: 93010 to 14 minutes: 1,04515 to 19 minutes: 1,51120 to 24 minutes: 1,21325 to 29 minutes: 69530 to 34 minutes: 2,20835 to 39 minutes: 90340 to 44 minutes: 90445 to 59 minutes: 2,25360 to 89 minutes: 1,35490 or more minutes: 346
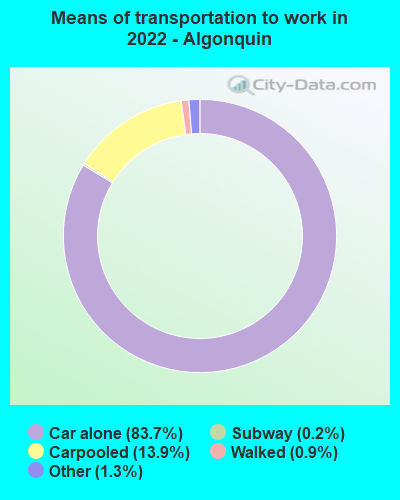
Means of transportation to work:
Drove a car alone: 8,351 (60.1%)Carpooled: 1,553 (11.2%)Bus : 6 (0.0%)Long-distance train or commuter rail : 12 (0.1%)Taxi: 193 (1.4%)Walked: 91 (0.7%)Worked at home: 3,946 (28.4%)
Unemployment by race in 2022
Unemployment rate for White non-Hispanic residents 3.1% Males4.1% FemalesUnemployment rate for Black residents 8.6% MalesUnemployment rate for Asian residents 5.1% Males6.4% FemalesUnemployment rate for other race residents 3.3% FemalesUnemployment rate for two or more race residents 5.5% Males1.2% FemalesUnemployment rate for Hispanic or Latino residents 5.8% Males0.3% Females
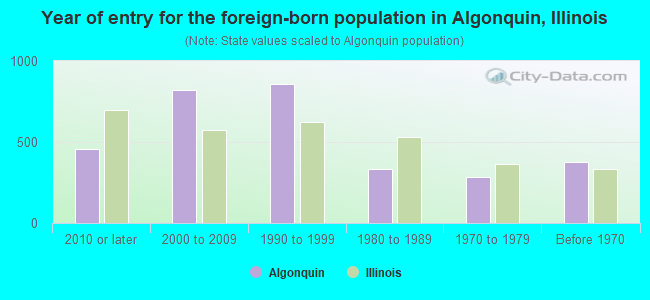
Year of entry for the foreign-born population in Algonquin, Illinois
456 2010 or later 818 2000 to 2009 858 1990 to 1999 332 1980 to 1989 285 1970 to 1979 378 Before 1970
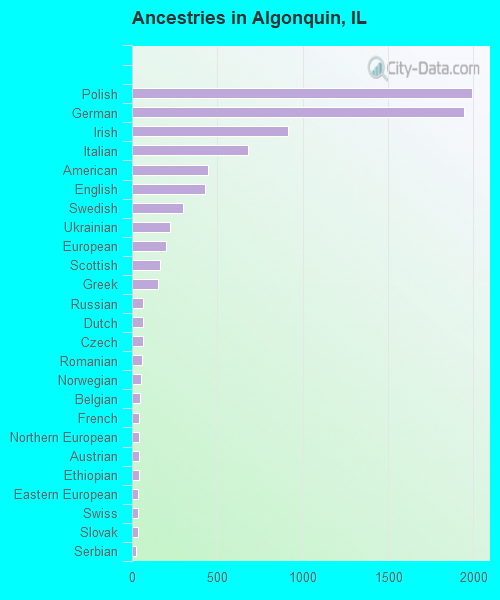
First ancestries reported:
Polish: 1,992 (17.3%)
German: 1,945 (16.9%)
Irish: 914 (7.9%)
Italian: 678 (5.9%)
American: 446 (3.9%)
English: 429 (3.7%)
Swedish: 297 (2.6%)
Ukrainian: 221 (1.9%)
European: 198 (1.7%)
Scottish: 166 (1.4%)
Greek: 155 (1.3%)
Russian: 66 (0.6%)
Dutch: 64 (0.6%)
Czech: 62 (0.5%)
Romanian: 57 (0.5%)
Norwegian: 55 (0.5%)
Belgian: 47 (0.4%)
French: 41 (0.4%)
Northern European: 40 (0.3%)
Austrian: 39 (0.3%)
Ethiopian: 39 (0.3%)
Eastern European: 37 (0.3%)
Swiss: 35 (0.3%)
Slovak: 33 (0.3%)
Serbian: 22 (0.2%)
Finnish: 20 (0.2%)
Syrian: 19 (0.2%)
Scotch-Irish: 19 (0.2%)
Lithuanian: 18 (0.2%)
Jamaican: 14 (0.1%)
French Canadian: 12 (0.1%)
Hungarian: 11 (0.10%)
Assyrian: 9 (0.08%)
Cajun: 4 (0.03%)
British: 4 (0.03%) Most common places of birth for foreign-born residents (%): Mexico Algonquin:
22.4% (780)Illinois:
34.7% (626,958)
Poland Algonquin:
21.8% (757)Illinois:
6.9% (124,474)
Korea Algonquin:
6.4% (223)Illinois:
2.2% (40,393)
Philippines Algonquin:
5.4% (188)Illinois:
5.2% (93,003)
India Algonquin:
4.6% (159)Illinois:
9.2% (166,409)
Ukraine Algonquin:
4.1% (142)Illinois:
1.6% (29,316)
Vietnam Algonquin:
4.1% (142)Illinois:
1.2% (22,269)
Pakistan Algonquin:
3.5% (122)Illinois:
1.6% (29,519)
Greece Algonquin:
2.2% (75)Illinois:
0.6% (10,720)
Ethiopia Algonquin:
2.2% (75)Illinois:
0.3% (4,775)
Egypt Algonquin:
2.0% (68)Illinois:
0.3% (5,762)
Ireland Algonquin:
1.9% (66)Illinois:
0.4% (6,611)
Italy Algonquin:
1.8% (64)Illinois:
0.9% (15,679)
Other Western Asia Algonquin:
1.6% (54)Illinois:
0.0% (679)
Germany Algonquin:
1.5% (53)Illinois:
1.0% (18,753)
Place of birth for U.S.-born residents:
This state: 21,291Other state: 4,506Northeast: 720Midwest: 2,671South: 668West: 455 92.3% of Algonquin residents lived in the same house 1 years ago.
Out of people who lived in different houses, 19.9% lived in this county.
Out of people who lived in different counties, 91.8% lived in Illinois.
Algonquin:
92.3%State average:
88.3%
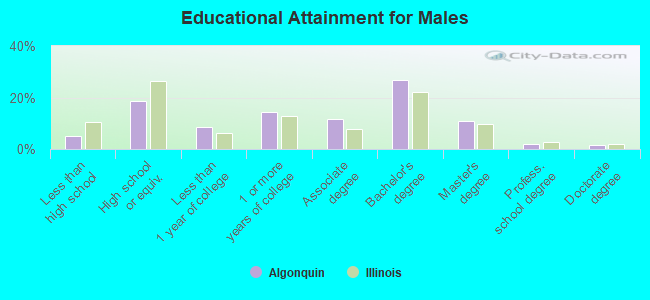
Education attainment for males 25 years and older:
No schooling: 36Nursery to 4th grade: 425th and 6th grade: 1447th and 8th grade: 09th grade: 1810th grade: 10411th grade: 912th grade, no diploma: 180High school graduate (or equivalency): 1,944Less than 1 year of college: 888Some college more than 1 year, no degree: 1,504Associate degree: 1,196Bachelor's degree: 2,776Master's degree: 1,125Professional school degree: 204Doctorate degree: 173
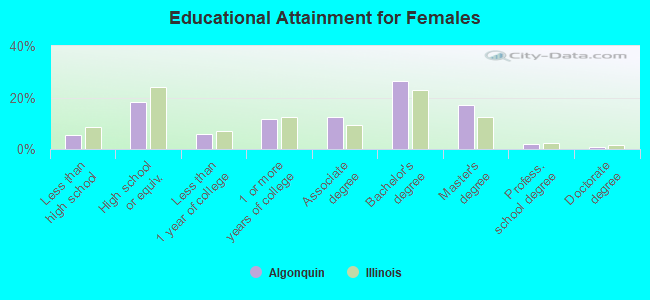
Education attainment for females 25 years and older:
No schooling: 155Nursery to 4th grade: 255th and 6th grade: 337th and 8th grade: 09th grade: 12610th grade: 4011th grade: 6312th grade, no diploma: 165High school graduate (or equivalency): 1,974Less than 1 year of college: 649Some college more than 1 year, no degree: 1,268Associate degree: 1,339Bachelor's degree: 2,908Master's degree: 1,889Professional school degree: 195Doctorate degree: 102
Housing units in structures:
One, detached: 8,195One, attached: 1,992Two: 313 or 4: 2975 to 9: 14910 to 19: 11020 to 49: 5650 or more: 369Housing units lacking complete plumbing facilities in 2022: 0.1%Housing units lacking complete kitchen facilities in 2022: 0.5%House/condo owner moved in on average 13 years ago
Renter moved in on average 2 years ago
Private vs. public school enrollment:
Students in private schools in grades 1 to 8 (elementary and middle school): 160 Students in private schools in grades 9 to 12 (high school): 70 Students in private undergraduate colleges: 331