Artesia, CA (California) Houses and Residents
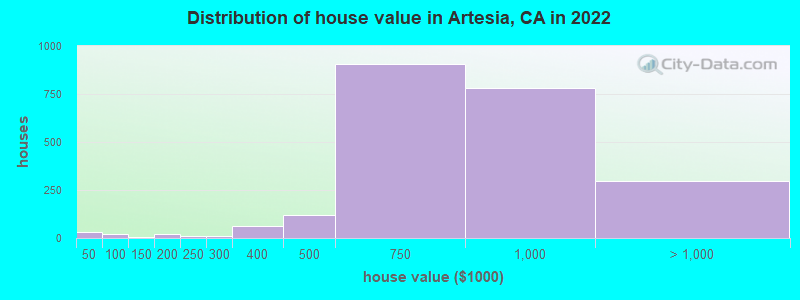
Estimated median house or condo value in 2022: $767,862 (it was $187,300 in 2000 )
Artesia:
$767,862California:
$715,900
Lower value quartile - upper value quartile: $597,871 - $968,613Mean price in 2022: Detached houses: $908,308 Here:
$908,308State:
$988,808
Townhouses or other attached units: $860,771 Here:
$860,771State:
$838,546
In 3-to-4-unit structures: $1,163,242 Here:
$1,163,242State:
$824,253
In 5-or-more-unit structures: $404,784 Here:
$404,784State:
$730,996
Mobile homes: $98,238 Here:
$98,238State:
$184,506
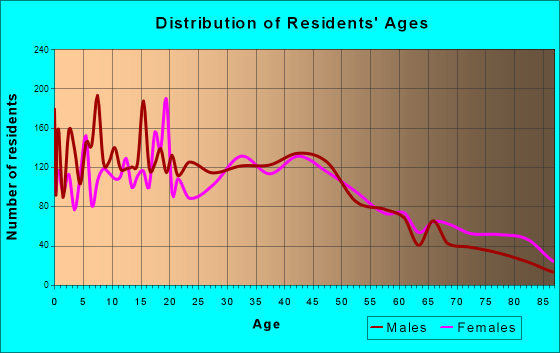
Total population: 16,895 (Urban population: 16,380, Rural population: 0)
Houses: 4,829 (4,536 occupied: 2,359 owner occupied, 2,194 renter occupied )
% of renters here:
48%State:
44%
Housing density: 2,985 houses/condos per square mile
Median price asked for vacant for-sale houses and condos in 2022: $803,392.
Median contract rent in 2022: $1,856 (lower quartile is $1,458, upper quartile is over $2,000)
Median rent asked for vacant for-rent units in 2022: $1,358
Median gross rent in Artesia, CA in 2022: over $2,000
Housing units in Artesia with a mortgage: 1,538 (154 second mortgage, 0 home equity loan, 95 both second mortgage and home equity loan )Houses without a mortgage: 0
Median household income for houses/condos with a mortgage: $112,483
Median household income for apartments without a mortgage: $82,576
Median monthly housing costs: $2,090
Data:
Median house or condo value ($)
Median house or condo value ($ change since 2000)
Median house or condo value ($) - White
Median house or condo value ($) - Black or African American
Median house or condo value ($) - Asian
Median house or condo value ($) - Hispanic or Latino
Median house or condo value ($) - American Indian and Alaska Native
Median house or condo value ($) - Multirace
Median house or condo value ($) - Other Race
Median price asked for mobile homes ($)
Household density (households per square mile)
Mean house or condo value by units in structure - 1, detached ($)
Mean house or condo value by units in structure - 1, attached ($)
Mean house or condo value by units in structure - 2 ($)
Mean house or condo value by units in structure by units in structure - 3 or 4 ($)
Mean house or condo value by units in structure - 5 or more ($)
Mean house or condo value by units in structure - Boat, RV, van, etc. ($)
Mean house or condo value by units in structure - Mobile home ($)
Median contract rent ($)
Median contract rent - Lower quartile ($)
Median contract rent - Upper quartile ($)
Median gross rent ($)
Urban houses (%)
Rural houses (%)
Houses occupied (%)
Houses occupied (% change since 2000)
Houses owner occupied (%)
Houses owner occupied (% change since 2000)
Houses renter occupied (%)
Houses renter occupied (% change since 2000)
Vacant housing units - For rent (%)
Vacant housing units - For rent (% change since 2000)
Vacant housing units - For sale only (%)
Vacant housing units - For sale only (% change since 2000)
Vacant housing units - Rented or sold, not occupied (%)
Vacant housing units - Rented or sold, not occupied (% change since 2000)
Vacant housing units - For seasonal, recreational, or occasional use (%)
Vacant housing units - For seasonal, recreational, or occasional use (% change since 2000)
Vacant housing units - For migrant workers (%)
Vacant housing units - For migrant workers (% change since 2000)
Vacant housing units - Other vacant (%)
Vacant housing units - Other vacant (% change since 2000)
Median monthly housing costs ($)
Median household income for houses/condos with a mortgage ($)
Median household income for houses/condos without a mortgage ($)
Median household income ($)
Median household income ($) - White
Median household income ($) - Black or African American
Median household income ($) - Asian
Median household income ($) - Hispanic or Latino
Median household income ($) - American Indian and Alaska Native
Median household income ($) - Multirace
Median household income ($) - Other Race
Mortgage status - with mortgage (%)
Mortgage status - with second mortgage (%)
Mortgage status - with home equity loan (%)
Mortgage status - with both second mortgage and home equity loan (%)
Mortgage status - without a mortgage (%)
Median year house/condo built
Median year apartment built
Household type by relationship - Male householder living alone (%)
Household type by relationship - Male householder not living alone (%)
Household type by relationship - Female householder living alone (%)
Household type by relationship - Female householder not living alone (%)
Household type by relationship - Opposite-Sex spouse (%)
Household type by relationship - Same-Sex spouse (%)
Household type by relationship - Opposite-Sex unmarried partner (%)
Household type by relationship - Same-Sex unmarried partner (%)
Household type by relationship - In group quarters (%)
Size of family households - 2-person household (%)
Size of family households - 3-person household (%)
Size of family households - 4-person household (%)
Size of family households - 5-person household (%)
Size of family households - 6-person household (%)
Size of family households - 7-or-more-person household (%)
Size of nonfamily households - 1-person household (%)
Size of nonfamily households - 2-person household (%)
Size of nonfamily households - 3-person household (%)
Size of nonfamily households - 4-person household (%)
Size of nonfamily households - 5-person household (%)
Size of nonfamily households - 6-person household (%)
Size of nonfamily households - 7-or-moreperson household (%)
Year house built - Built 2010 or later (%)
Year house built - Built 2000 to 2009 (%)
Year house built - Built 1990 to 1999 (%)
Year house built - Built 1980 to 1989 (%)
Year house built - Built 1970 to 1979 (%)
Year house built - Built 1960 to 1969 (%)
Year house built - Built 1950 to 1959 (%)
Year house built - Built 1940 to 1949 (%)
Year house built - Built 1939 or earlier (%)
Median number of rooms in houses and condos
Median number of rooms in apartments
Median number of bedrooms in owner occupied houses
Mean number of bedrooms in owner occupied houses
Median number of bedrooms in renter occupied houses
Mean number of bedrooms in renter occupied houses
Median number of vehichles in owner occupied houses
Mean number of vehichles in owner occupied houses
Median number of vehichles in renter occupied houses
Mean number of vehichles in renter occupied houses
Rooms in owner-occupied houses - 1 room (%)
Rooms in owner-occupied houses - 2 rooms (%)
Rooms in owner-occupied houses - 3 rooms (%)
Rooms in owner-occupied houses - 4 rooms (%)
Rooms in owner-occupied houses - 5 rooms (%)
Rooms in owner-occupied houses - 6 rooms (%)
Rooms in owner-occupied houses - 7 rooms (%)
Rooms in owner-occupied houses - 8 rooms (%)
Rooms in owner-occupied houses - 9+ rooms (%)
Rooms in renter-occupied houses - 1 room (%)
Rooms in renter-occupied houses - 2 rooms (%)
Rooms in renter-occupied houses - 3 rooms (%)
Rooms in renter-occupied houses - 4 rooms (%)
Rooms in renter-occupied houses - 5 rooms (%)
Rooms in renter-occupied houses - 6 rooms (%)
Rooms in renter-occupied houses - 7 rooms (%)
Rooms in renter-occupied houses - 8 rooms (%)
Rooms in renter-occupied houses - 9+ rooms (%)
Bedrooms in owner-occupied houses - no bedrooms (%)
Bedrooms in owner-occupied houses - 1 bedroom (%)
Bedrooms in owner-occupied houses - 2 bedrooms (%)
Bedrooms in owner-occupied houses - 3 bedrooms (%)
Bedrooms in owner-occupied houses - 4 bedrooms (%)
Bedrooms in owner-occupied houses - 5+ bedrooms (%)
Bedrooms in renter-occupied houses - no bedrooms (%)
Bedrooms in renter-occupied houses - 1 bedroom (%)
Bedrooms in renter-occupied houses - 2 bedrooms (%)
Bedrooms in renter-occupied houses - 3 bedrooms (%)
Bedrooms in renter-occupied houses - 4 bedrooms (%)
Bedrooms in renter-occupied houses - 5+ bedrooms (%)
Vehicles available in owner-occupied houses - no vehicle available (%)
Vehicles available in owner-occupied houses - 1 vehicle available(%)
Vehicles available in owner-occupied houses - 2 Vehicles available (%)
Vehicles available in owner-occupied houses - 3 Vehicles available (%)
Vehicles available in owner-occupied houses - 4 Vehicles available (%)
Vehicles available in owner-occupied houses - 5+ Vehicles available (%)
Vehicles available in renter-occupied houses - no vehicle available (%)
Vehicles available in renter-occupied houses - 1 vehicle available (%)
Vehicles available in renter-occupied houses - 2 Vehicles available (%)
Vehicles available in renter-occupied houses - 3 Vehicles available (%)
Vehicles available in renter-occupied houses - 4 Vehicles available (%)
Vehicles available in renter-occupied houses - 5+ Vehicles available (%)
Housing units in structures - 1, detached (%)
Housing units in structures - 1, attached (%)
Housing units in structures - 2 (%)
Housing units in structures - 3 or 4 (%)
Housing units in structures - 5 to 9 (%)
Housing units in structures - 10 to 19 (%)
Housing units in structures - 20 to 49 (%)
Housing units in structures - 50 or more (%)
Housing units in structures - Mobile home (%)
Housing units in structures - Boat, RV, van, etc. (%)
Housing units in structures - Owners - 1, detached (%)
Housing units in structures - Owners - 1, attached (%)
Housing units in structures - Owners - 2 (%)
Housing units in structures - Owners - 3 or 4 (%)
Housing units in structures - Owners - 5 to 9 (%)
Housing units in structures - Owners - 10 to 19 (%)
Housing units in structures - Owners - 20 to 49 (%)
Housing units in structures - Owners - 50 or more (%)
Housing units in structures - Owners - Mobile home (%)
Housing units in structures - Owners - Boat, RV, van, etc. (%)
Housing units in structures - Renters - 1, detached (%)
Housing units in structures - Renters - 1, attached (%)
Housing units in structures - Renters - 2 (%)
Housing units in structures - Renters - 3 or 4 (%)
Housing units in structures - Renters - 5 to 9 (%)
Housing units in structures - Renters - 10 to 19 (%)
Housing units in structures - Renters - 20 to 49 (%)
Housing units in structures - Renters - 50 or more (%)
Housing units in structures - Renters - Mobile home (%)
Housing units in structures - Renters - Boat, RV, van, etc. (%)
House/condo owner moved in on average (years ago)
Renter moved in on average (years ago)
Year householder moved into unit - Moved in 1999 to March 2000 (%)
Year householder moved into unit - Moved in 1999 to March 2000 (%) - White
Year householder moved into unit - Moved in 1999 to March 2000 (%) - Black or African American
Year householder moved into unit - Moved in 1999 to March 2000 (%) - Asian
Year householder moved into unit - Moved in 1999 to March 2000 (%) - Hispanic or Latino
Year householder moved into unit - Moved in 1999 to March 2000 (%) - American Indian and Alaska Native
Year householder moved into unit - Moved in 1999 to March 2000 (%) - Multirace
Year householder moved into unit - Moved in 1999 to March 2000 (%) - Other Race
Year householder moved into unit - Moved in 1995 to 1998 (%)
Year householder moved into unit - Moved in 1995 to 1998 (%) - White
Year householder moved into unit - Moved in 1995 to 1998 (%) - Black or African American
Year householder moved into unit - Moved in 1995 to 1998 (%) - Asian
Year householder moved into unit - Moved in 1995 to 1998 (%) - Hispanic or Latino
Year householder moved into unit - Moved in 1995 to 1998 (%) - American Indian and Alaska Native
Year householder moved into unit - Moved in 1995 to 1998 (%) - Multirace
Year householder moved into unit - Moved in 1995 to 1998 (%) - Other Race
Year householder moved into unit - Moved in 1990 to 1994 (%)
Year householder moved into unit - Moved in 1990 to 1994 (%) - White
Year householder moved into unit - Moved in 1990 to 1994 (%) - Black or African American
Year householder moved into unit - Moved in 1990 to 1994 (%) - Asian
Year householder moved into unit - Moved in 1990 to 1994 (%) - Hispanic or Latino
Year householder moved into unit - Moved in 1990 to 1994 (%) - American Indian and Alaska Native
Year householder moved into unit - Moved in 1990 to 1994 (%) - Multirace
Year householder moved into unit - Moved in 1990 to 1994 (%) - Other Race
Year householder moved into unit - Moved in 1980 to 1989 (%)
Year householder moved into unit - Moved in 1980 to 1989 (%) - White
Year householder moved into unit - Moved in 1980 to 1989 (%) - Black or African American
Year householder moved into unit - Moved in 1980 to 1989 (%) - Asian
Year householder moved into unit - Moved in 1980 to 1989 (%) - Hispanic or Latino
Year householder moved into unit - Moved in 1980 to 1989 (%) - American Indian and Alaska Native
Year householder moved into unit - Moved in 1980 to 1989 (%) - Multirace
Year householder moved into unit - Moved in 1980 to 1989 (%) - Other Race
Year householder moved into unit - Moved in 1970 to 1979 (%)
Year householder moved into unit - Moved in 1970 to 1979 (%) - White
Year householder moved into unit - Moved in 1970 to 1979 (%) - Black or African American
Year householder moved into unit - Moved in 1970 to 1979 (%) - Asian
Year householder moved into unit - Moved in 1970 to 1979 (%) - Hispanic or Latino
Year householder moved into unit - Moved in 1970 to 1979 (%) - American Indian and Alaska Native
Year householder moved into unit - Moved in 1970 to 1979 (%) - Multirace
Year householder moved into unit - Moved in 1970 to 1979 (%) - Other Race
Year householder moved into unit - Moved in 1969 or earlier (%)
Year householder moved into unit - Moved in 1969 or earlier (%) - White
Year householder moved into unit - Moved in 1969 or earlier (%) - Black or African American
Year householder moved into unit - Moved in 1969 or earlier (%) - Asian
Year householder moved into unit - Moved in 1969 or earlier (%) - Hispanic or Latino
Year householder moved into unit - Moved in 1969 or earlier (%) - American Indian and Alaska Native
Year householder moved into unit - Moved in 1969 or earlier (%) - Multirace
Year householder moved into unit - Moved in 1969 or earlier (%) - Other Race
Housing units lacking complete plumbing facilities (%)
Housing units lacking complete kitchen facilities (%)
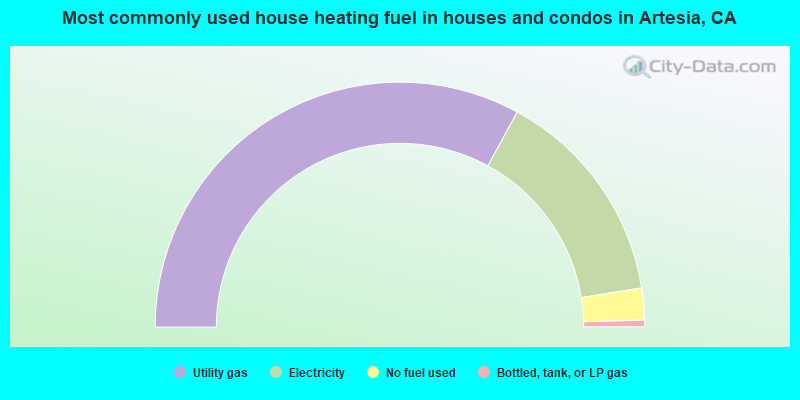
House heating fuel used in houses and condos - Utility gas (%)
House heating fuel used in houses and condos - Bottled, tank, or LP gas (%)
House heating fuel used in houses and condos - Electricity (%)
House heating fuel used in houses and condos - Fuel oil, kerosene, etc. (%)
House heating fuel used in houses and condos - Coal or coke (%)
House heating fuel used in houses and condos - Wood (%)
House heating fuel used in houses and condos - Solar energy (%)
House heating fuel used in houses and condos - Other fuel (%)
House heating fuel used in houses and condos - No fuel used (%)
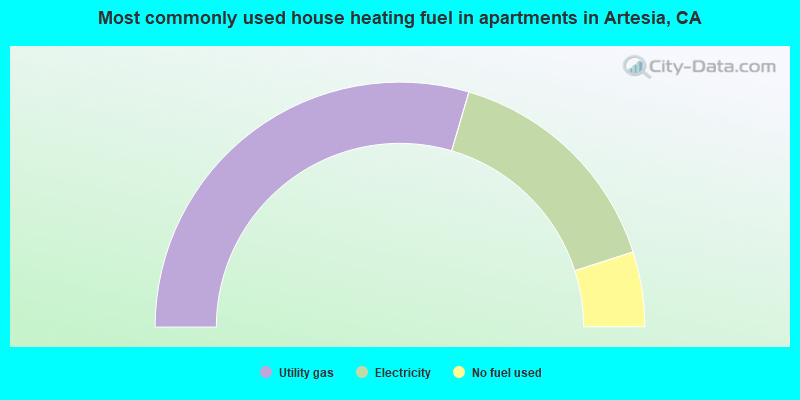
House heating fuel used in apartments - Utility gas (%)
House heating fuel used in apartments - Bottled, tank, or LP gas (%)
House heating fuel used in apartments - Electricity (%)
House heating fuel used in apartments - Fuel oil, kerosene, etc. (%)
House heating fuel used in apartments - Coal or coke (%)
House heating fuel used in apartments - Wood (%)
House heating fuel used in apartments - Solar energy (%)
House heating fuel used in apartments - Other fuel (%)
House heating fuel used in apartments - No fuel used (%)
Latest news about housing in Artesia, CA collected exclusively by city-data.com from local newspapers, TV, and radio stations
Median year house/condo built: 1960Median year apartment built: 1971Household type by relationship:
Households: 15,884
Male householders: 2,353 (138 living alone ), Female householders: 2,032 (436 living alone )2,451 spouses (2,429 opposite-sex spouses ), 135 unmarried partners , (135 opposite-sex unmarried partners ), 4,581 children (4,478 natural , 95 adopted , 6 stepchildren ), 740 grandchildren , 416 brothers or sisters , 859 parents , 0 foster children , 1,040 other relatives , 705 non-relatives In group quarters: 565
Size of family households: 924 2-persons , 881 3-persons , 1,070 4-persons , 511 5-persons , 129 6-persons , 181 7-or-more-persons .
Size of nonfamily households: 617 1-person , 139 2-persons , 24 3-persons , 9 6-persons , 17 7-or-more-persons .
1,731 married couples with children. single-parent households (49 men , 289 women ).
33.9% of residents of Artesia speak English at home. of residents speak Spanish at home (58% speak English very well , 18% speak English well , 14% speak English not well , 10% don't speak English at all ).of residents speak other Indo-European language at home (64% speak English very well , 23% speak English well , 6% speak English not well , 7% don't speak English at all ).of residents speak Asian or Pacific Island language at home (62% speak English very well , 25% speak English well , 11% speak English not well , 1% don't speak English at all ).of residents speak other language at home (100% speak English not well ).
Foreign born population: 7,658 (48.2%)of them are naturalized citizens )
Median number of rooms in houses and condos:
Median number of rooms in apartments
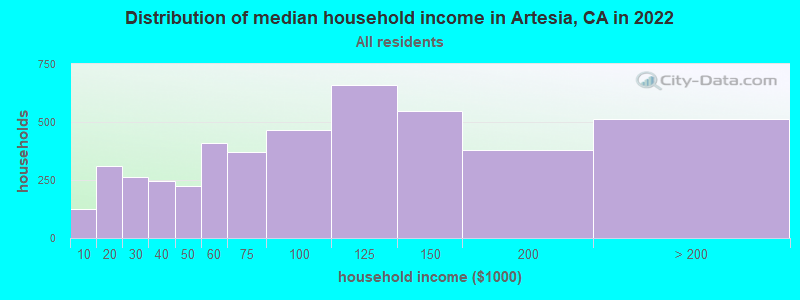
Artesia, CA household income distribution 123 Less than $10,000312 $10,000 to $19,999264 $20,000 to $29,999245 $30,000 to $39,999222 $40,000 to $49,999410 $50,000 to $59,999370 $60,000 to $74,999464 $75,000 to $99,999659 $100,000 to $124,999549 $125,000 to $149,999379 $150,000 to $199,999513 $200,000 or more
Home value of owner - occupied houses in 2022 in Artesia, CA 30 Less than $10,0008 $50,000 to $59,99914 $60,000 to $69,9996 $100,000 to $124,99910 $150,000 to $174,99911 $175,000 to $199,9999 $200,000 to $249,9998 $250,000 to $299,99959 $300,000 to $399,999120 $400,000 to $499,999905 $500,000 to $749,999782 $750,000 to $999,999285 $1,000,000 to $1,499,99913 $2,000,000 or moreRent paid by renters in 2022 in Artesia, CA 19 $400 to $44917 $600 to $64917 $700 to $74927 $800 to $89960 $900 to $999194 $1,000 to $1,249235 $1,250 to $1,499771 $1,500 to $1,999413 $2,000 to $2,499398 $2,500 to $2,99947 $3,000 to $3,49910 $3,500 or more28 No cash rent
Percentage of workers working in this county: 74.7%Number of people working at home: 955 (13.7% of all workers )
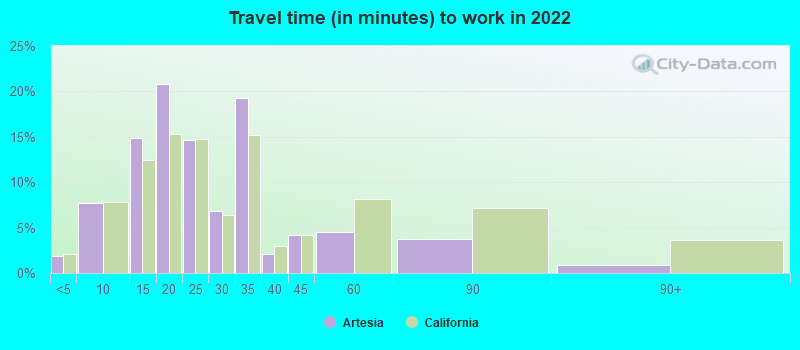
Travel time to work (commute)
Less than 5 minutes: 1415 to 9 minutes: 54610 to 14 minutes: 1,06515 to 19 minutes: 89120 to 24 minutes: 85125 to 29 minutes: 22330 to 34 minutes: 67935 to 39 minutes: 18140 to 44 minutes: 25545 to 59 minutes: 62460 to 89 minutes: 39390 or more minutes: 162
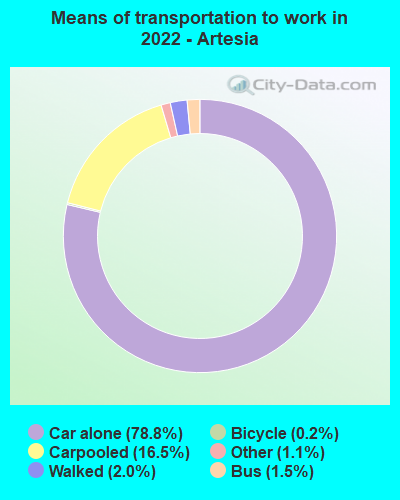
Means of transportation to work:
Drove a car alone: 2,870 (62.7%)Carpooled: 664 (14.5%)Bus : 48 (1.0%)Taxi: 42 (0.9%)Bicycle: 6 (0.1%)Walked: 76 (1.7%)Worked at home: 955 (20.9%)
Unemployment by race in 2022
Unemployment rate for White non-Hispanic residents 2.9% MalesUnemployment rate for Black residents 40.3% FemalesUnemployment rate for Asian residents 6.8% Males8.4% FemalesUnemployment rate for other race residents 11.9% Males10.8% FemalesUnemployment rate for two or more race residents 1.1% MalesUnemployment rate for Hispanic or Latino residents 9.3% Males6.9% Females
Year of entry for the foreign-born population in Artesia, California
1,844 2010 or later 1,773 2000 to 2009 1,745 1990 to 1999 2,412 1980 to 1989 1,396 1970 to 1979 996 Before 1970
First ancestries reported:
Portuguese: 828 (7.5%)
American: 201 (1.8%)
Dutch: 106 (1.0%)
English: 60 (0.5%)
German: 57 (0.5%)
European: 38 (0.3%)
Swedish: 27 (0.2%)
Irish: 25 (0.2%)
Scotch-Irish: 23 (0.2%)
Italian: 22 (0.2%)
French: 19 (0.2%)
Austrian: 11 (0.10%)
Egyptian: 9 (0.08%)
Croatian: 9 (0.08%)
Lebanese: 7 (0.06%)
Iranian: 7 (0.06%)
Northern European: 5 (0.05%) Most common places of birth for foreign-born residents (%): Mexico Artesia:
22.7% (1,735)California:
37.2% (3,881,193)
Philippines Artesia:
21.8% (1,670)California:
7.8% (818,297)
India Artesia:
19.8% (1,515)California:
5.2% (539,184)
Portugal Artesia:
6.4% (488)California:
0.2% (25,462)
Korea Artesia:
6.1% (468)California:
3.0% (315,248)
El Salvador Artesia:
3.2% (243)California:
4.2% (440,287)
Vietnam Artesia:
3.2% (242)California:
4.9% (512,335)
Pakistan Artesia:
2.7% (205)California:
0.5% (49,399)
Nepal Artesia:
2.4% (184)California:
0.2% (16,541)
South Africa Artesia:
2.3% (178)California:
0.2% (20,614)
Taiwan Artesia:
2.2% (172)California:
1.7% (176,274)
Place of birth for U.S.-born residents:
This state: 7,177Other state: 805Northeast: 153Midwest: 400South: 159West: 85 92.5% of Artesia residents lived in the same house 1 years ago.
Out of people who lived in different houses, 38.7% lived in this county.
Out of people who lived in different counties, 89.7% lived in California.
Artesia:
92.5%State average:
88.9%
Education attainment for males 25 years and older:
No schooling: 192Nursery to 4th grade: 1225th and 6th grade: 1497th and 8th grade: 439th grade: 14110th grade: 3011th grade: 4912th grade, no diploma: 315High school graduate (or equivalency): 1,274Less than 1 year of college: 148Some college more than 1 year, no degree: 763Associate degree: 343Bachelor's degree: 1,191Master's degree: 355Professional school degree: 109Doctorate degree: 123
Education attainment for females 25 years and older:
No schooling: 291Nursery to 4th grade: 1985th and 6th grade: 2987th and 8th grade: 429th grade: 25910th grade: 10511th grade: 10512th grade, no diploma: 151High school graduate (or equivalency): 1,341Less than 1 year of college: 283Some college more than 1 year, no degree: 704Associate degree: 639Bachelor's degree: 1,347Master's degree: 243Professional school degree: 7Doctorate degree: 33
Housing units in structures:
One, detached: 3,395One, attached: 180Two: 1253 or 4: 3175 to 9: 18210 to 19: 18020 to 49: 9650 or more: 208Mobile homes: 143Housing units lacking complete plumbing facilities in 2022: 0.7%Housing units lacking complete kitchen facilities in 2022: 6.7%House/condo owner moved in on average 20 years ago
Renter moved in on average 8 years ago
Private vs. public school enrollment:
Students in private schools in grades 1 to 8 (elementary and middle school): 65 Here:
4.8%California:
10.5%
Students in private schools in grades 9 to 12 (high school): 22 Students in private undergraduate colleges: 127 Here:
11.9%California:
15.9%