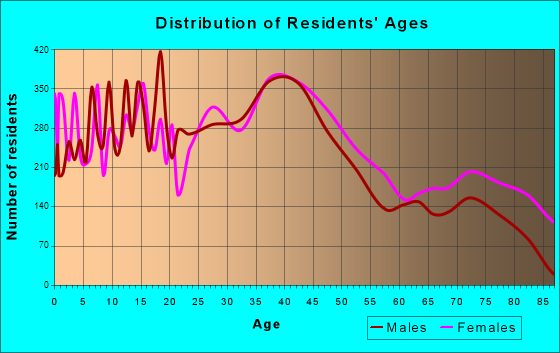
Belleville, IL (Illinois) Houses and Residents
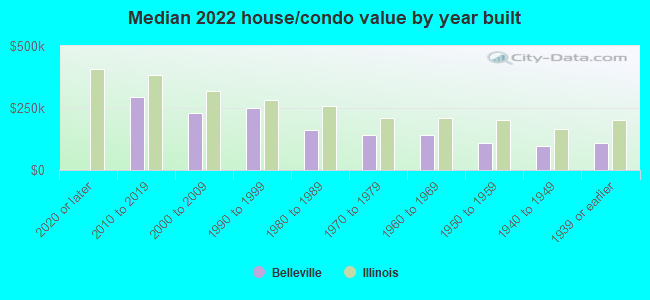
| Belleville: | $131,680 |
| Illinois: | $251,600 |
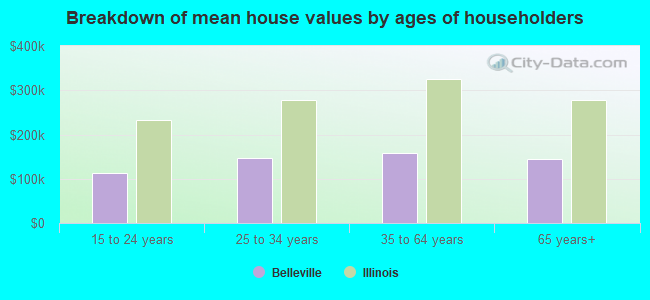
Mean price in 2022:
Detached houses: $145,676
Here: $145,676 State: $310,164 Townhouses or other attached units: $158,953
Here: $158,953 State: $286,230 In 2-unit structures: $219,289
Here: $219,289 State: $299,638 In 3-to-4-unit structures: $112,545
Here: $112,545 State: $330,907 In 5-or-more-unit structures: $155,601
Here: $155,601 State: $318,887 Mobile homes: $39,208
Here: $39,208 State: $78,855
Total population: 42,529 (Urban population: 41,986, Rural population: 179 (all nonfarm))
Houses: 20,413 (17,652 occupied: 11,126 owner occupied, 6,673 renter occupied)
| % of renters here: | 37% |
| State: | 33% |
Housing density: 1,083 houses/condos per square mile
Median price asked for vacant for-sale houses and condos in 2022: $160,370.
Median contract rent in 2022: $697 (lower quartile is $536, upper quartile is $913)
Median rent asked for vacant for-rent units in 2022: $1,097
Median gross rent in Belleville, IL in 2022: $912
Housing units in Belleville with a mortgage: 7,450 (578 second mortgage, 0 home equity loan, 545 both second mortgage and home equity loan)
Houses without a mortgage: 199
Median household income for houses/condos with a mortgage: $81,655
Median household income for apartments without a mortgage: $64,810
Median monthly housing costs: $994
Compare current foreclosures in Belleville, IL:
| Photo | Address | Area | Beds / Baths | Price | Details |
|---|---|---|---|---|---|

|
#1
West Blvd
Belleville, IL 62221
|
1,462 sq. feet
|
2 baths 2 beds |
$195,000
|
show details |

|
#2
S 18th St
Belleville, IL 62226
|
- sq. feet
|
1 baths 4 beds |
$47,250
|
show details |

|
#3
Optimist Dr
Belleville, IL 62220
|
- sq. feet
|
1 baths 3 beds |
$57,200
|
show details |

|
#4
Old Caseyville Rd
Belleville, IL 62226
|
1,134 sq. feet
|
1 baths 3 beds |
show details | |

|
#5
N Park Dr
Belleville, IL 62226
|
1,392 sq. feet
|
1 baths 3 beds |
show details | |

|
#6
S 34th St
Belleville, IL 62226
|
1,182 sq. feet
|
1 baths 2 beds |
show details | |

|
#7
Rusty Wil Dr
Belleville, IL 62220
|
724 sq. feet
|
1 baths 2 beds |
show details | |

|
#8
E Adams St
Belleville, IL 62220
|
2,108 sq. feet
|
1 baths 5 beds |
show details | |

|
#9
Granvue Dr
Belleville, IL 62223
|
3,415 sq. feet
|
3 baths 5 beds |
show details | |

|
#10
Castellano Dr
Belleville, IL 62226
|
1,066 sq. feet
|
1 baths 3 beds |
show details |
| Photo | Address | Area | Beds / Baths | Price | Details |
|---|---|---|---|---|---|

|
#11
Glen Grv
Belleville, IL 62226
|
1,198 sq. feet
|
1 baths 3 beds |
show details | |

|
#12
Mcclintock Ave
Belleville, IL 62221
|
1,000 sq. feet
|
2 baths 2 beds |
show details | |

|
#13
Saint John Dr
Belleville, IL 62221
|
1,026 sq. feet
|
3 baths 4 beds |
show details | |

|
#14
Frank Scott Pkwy W
Belleville, IL 62223
|
1,073 sq. feet
|
1 baths 3 beds |
show details | |

|
#15
N 17th St
Belleville, IL 62226
|
1,684 sq. feet
|
2 baths 4 beds |
show details | |

|
#16
Winchester Dr
Belleville, IL 62223
|
- sq. feet
|
- baths 3 beds |
$149,900
|
show details |

|
#17
Cascade Dr
Belleville, IL 62223
|
1,164 sq. feet
|
1 baths 3 beds |
show details | |

|
#18
Farragut Ct
Belleville, IL 62221
|
1,104 sq. feet
|
2 baths 3 beds |
show details | |

|
#19
Hillcrest Dr
Belleville, IL 62221
|
2,120 sq. feet
|
2 baths 3 beds |
show details | |

|
#20
Marian Ct
Belleville, IL 62226
|
999 sq. feet
|
2 baths 3 beds |
show details |
| Photo | Address | Area | Beds / Baths | Price | Details |
|---|---|---|---|---|---|

|
#21
Bethesda Dr
Belleville, IL 62223
|
840 sq. feet
|
1 baths 2 beds |
show details | |

|
#22
Cresthaven Dr
Belleville, IL 62221
|
- sq. feet
|
1 baths 3 beds |
show details | |

|
#23
Granvue Dr
Belleville, IL 62223
|
- sq. feet
|
3 baths 6 beds |
show details | |

|
#24
N Delaware Ave
Belleville, IL 62221
|
1,368 sq. feet
|
- baths - beds |
show details | |

|
#25
N Florida Ave
Belleville, IL 62221
|
880 sq. feet
|
- baths - beds |
show details | |

|
#26
Celebration Park Cir
Belleville, IL 62220
|
638 sq. feet
|
- baths - beds |
show details | |

|
#27
Dovershire Dr
Belleville, IL 62221
|
950 sq. feet
|
- baths - beds |
show details | |

|
#28
N 36th St
Belleville, IL 62226
|
- sq. feet
|
1 baths 3 beds |
show details | |

|
#29
N 43rd St
Belleville, IL 62226
|
594 sq. feet
|
- baths - beds |
show details | |

|
#30
Caseyville Ave
Belleville, IL 62226
|
784 sq. feet
|
- baths - beds |
show details |
| Photo | Address | Area | Beds / Baths | Price | Details |
|---|---|---|---|---|---|

|
#31
Sycamore St
Belleville, IL 62220
|
1,179 sq. feet
|
- baths - beds |
show details | |

|
#32
Rose Marie Dr
Belleville, IL 62220
|
- sq. feet
|
- baths - beds |
show details | |

|
#33
Greystone Estates Pkwy
Belleville, IL 62221
|
- sq. feet
|
- baths - beds |
show details | |

|
#34
S 20th St
Belleville, IL 62226
|
- sq. feet
|
- baths - beds |
show details | |

|
#35
Cheyenne Wells Dr
Belleville, IL 62221
|
- sq. feet
|
- baths - beds |
show details | |

|
#36
Raab Ave
Belleville, IL 62220
|
- sq. feet
|
- baths - beds |
show details | |

|
#37
N 28th St
Belleville, IL 62226
|
- sq. feet
|
- baths - beds |
show details | |

|
#38
S Pennsylvania Ave
Belleville, IL 62220
|
- sq. feet
|
- baths - beds |
show details | |

|
#39
S 74th St
Belleville, IL 62223
|
- sq. feet
|
- baths - beds |
show details | |

|
#40
Plankway Dr
Belleville, IL 62221
|
- sq. feet
|
- baths - beds |
show details |
| Photo | Address | Area | Beds / Baths | Price | Details |
|---|---|---|---|---|---|

|
#41
N 12th St
Belleville, IL 62220
|
- sq. feet
|
- baths - beds |
show details | |

|
#42
Plantation Ln
Belleville, IL 62220
|
- sq. feet
|
- baths - beds |
show details | |

|
#43
University Ave
Belleville, IL 62221
|
- sq. feet
|
- baths - beds |
show details | |

|
#44
Bluff Ridge Ln
Belleville, IL 62221
|
- sq. feet
|
- baths - beds |
show details | |

|
#45
S 8th St
Belleville, IL 62220
|
- sq. feet
|
- baths - beds |
show details | |

|
#46
Derbyshire Dr
Belleville, IL 62226
|
- sq. feet
|
- baths - beds |
show details | |

|
#47
Glen Mor
Belleville, IL 62221
|
- sq. feet
|
- baths - beds |
show details | |

|
#48
Santa Fe Ct
Belleville, IL 62221
|
- sq. feet
|
- baths - beds |
show details | |

|
#49
Brookshire Ct Apt 4
Belleville, IL 62221
|
- sq. feet
|
- baths - beds |
show details | |

|
Check over 1 million property listings on Foreclosure.com!
|
browse all offers | |||

Latest news about housing in Belleville, IL collected exclusively by city-data.com from local newspapers, TV, and radio stations

 | Belleville vs Edwardsville vs O'Fallon (14 replies) |
| Liberal Southern Illinois Cities? (23 replies) |
| Why does most of downstate Illinois not care for Chicago? (191 replies) |
| East St. Louis... what happened there? (79 replies) |
| Interesting/quirky/off-the-beaten-path stuff to see in non-Chicagoland IL? (13 replies) |
| Granite City, IL Apartments? (7 replies) |
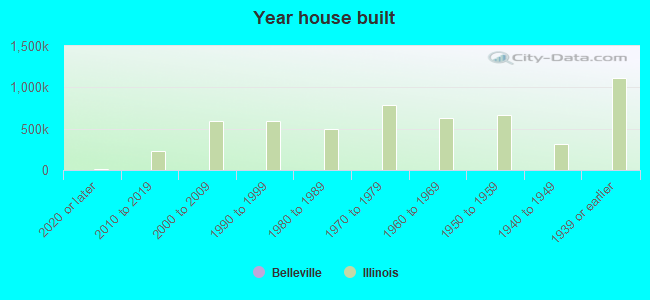
Median year apartment built: 1971
Household type by relationship:
Households: 41,478- Male householders: 7,972 (2,850 living alone), Female householders: 9,341 (3,713 living alone)
6,475 spouses (6,326 opposite-sex spouses), 1,184 unmarried partners, (1,166 opposite-sex unmarried partners), 12,051 children (10,647 natural, 498 adopted, 905 stepchildren), 1,044 grandchildren, 324 brothers or sisters, 280 parents, 234 foster children, 432 other relatives, 695 non-relatives
- In group quarters: 1,440
Size of family households: 4,143 2-persons, 2,925 3-persons, 1,704 4-persons, 841 5-persons, 195 6-persons, 211 7-or-more-persons.
Size of nonfamily households: 6,115 1-person, 1,411 2-persons, 92 3-persons, 4 4-persons.
4,403 married couples with children.
3,792 single-parent households (978 men, 2,814 women).
95.0% of residents of Belleville speak English at home.
1.6% of residents speak Spanish at home (57% speak English very well, 28% speak English well, 10% speak English not well, 5% don't speak English at all).
1.4% of residents speak other Indo-European language at home (81% speak English very well, 19% speak English well).
0.5% of residents speak Asian or Pacific Island language at home (55% speak English very well, 29% speak English well, 16% speak English not well).
0.9% of residents speak other language at home (69% speak English very well, 31% speak English well).
Foreign born population: 1,189 (2.9%)
(68.5% of them are naturalized citizens)
| Here: | 6.3 |
| State: | 6.4 |
| Here: | 4.1 |
| State: | 4.1 |
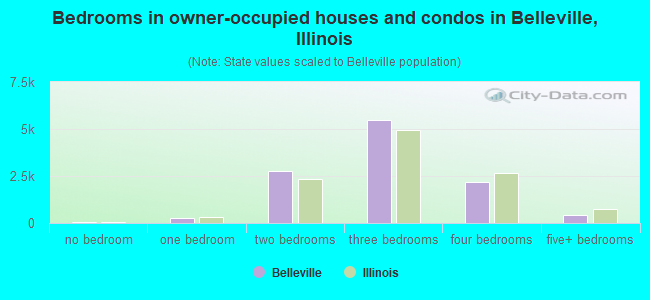
- Bedrooms in owner-occupied houses and condos in Belleville, Illinois
- 50no bedroom
- 2611 bedroom
- 2,7592 bedrooms
- 5,4573 bedrooms
- 2,1584 bedrooms
- 4435+ bedrooms
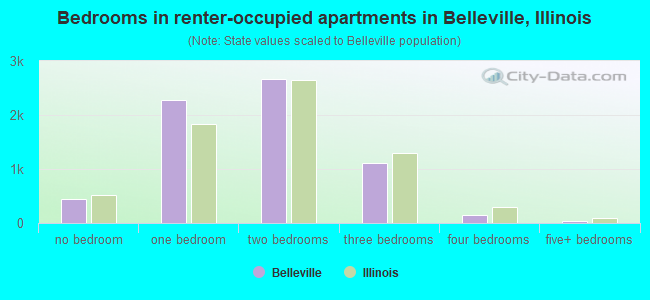
- Bedrooms in renter-occupied apartments in Belleville, Illinois
- 442no bedroom
- 2,2771 bedroom
- 2,6642 bedrooms
- 1,1073 bedrooms
- 1444 bedrooms
- 405+ bedrooms
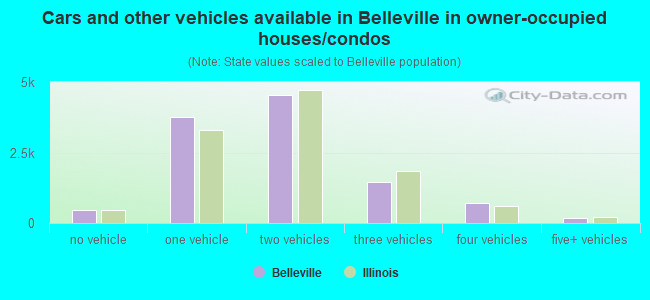
- Cars and other vehicles available in Belleville in owner-occupied houses/condos
- 475no vehicle
- 3,7661 vehicle
- 4,5362 vehicles
- 1,4523 vehicles
- 7154 vehicles
- 1825+ vehicles
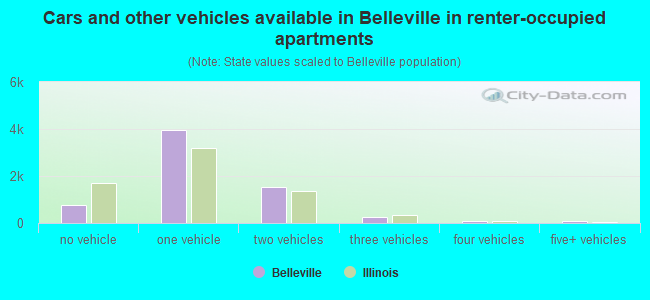
- Cars and other vehicles available in Belleville in renter-occupied apartments
- 786no vehicle
- 3,9381 vehicle
- 1,5282 vehicles
- 2563 vehicles
- 984 vehicles
- 685+ vehicles
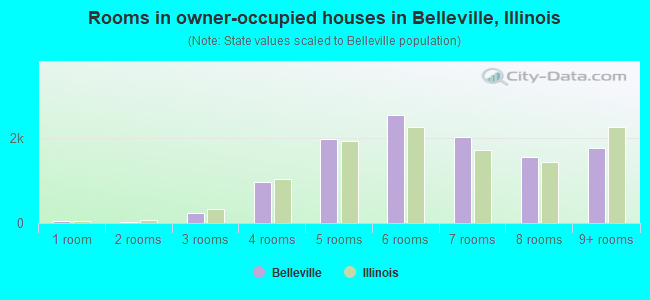
- Rooms in owner-occupied houses in Belleville, Illinois
- 501 room
- 212 rooms
- 2273 rooms
- 9734 rooms
- 1,9745 rooms
- 2,5496 rooms
- 2,0207 rooms
- 1,5508 rooms
- 1,7639+ rooms
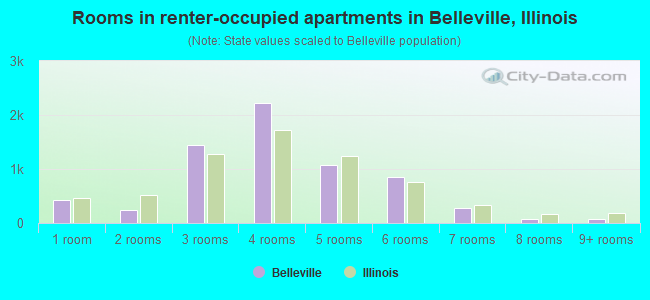
- Rooms in renter-occupied apartments in Belleville, Illinois
- 4271 room
- 2342 rooms
- 1,4503 rooms
- 2,2194 rooms
- 1,0685 rooms
- 8476 rooms
- 2807 rooms
- 838 rooms
- 669+ rooms
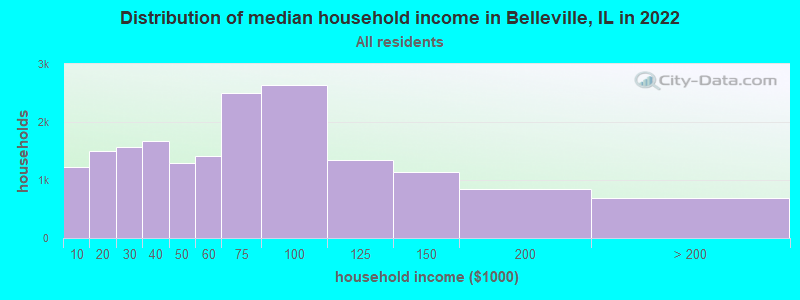
Belleville, IL household income distribution

- 1,229Less than $10,000
- 1,495$10,000 to $19,999
- 1,565$20,000 to $29,999
- 1,669$30,000 to $39,999
- 1,286$40,000 to $49,999
- 1,412$50,000 to $59,999
- 2,495$60,000 to $74,999
- 2,642$75,000 to $99,999
- 1,347$100,000 to $124,999
- 1,133$125,000 to $149,999
- 850$150,000 to $199,999
- 682$200,000 or more
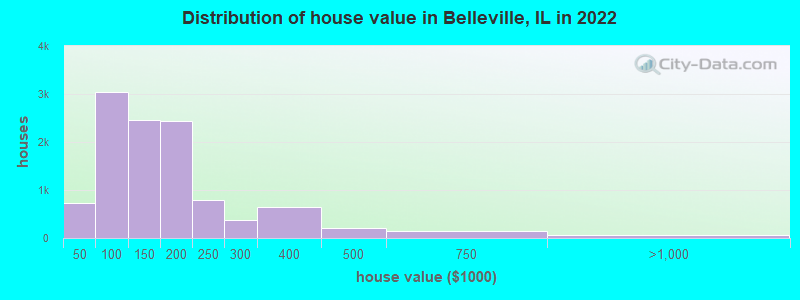
Home value of owner - occupied houses in 2022 in Belleville, IL
-
- 149Less than $10,000
- 112$10,000 to $14,999
- 142$15,000 to $19,999
- 43$20,000 to $24,999
- 71$25,000 to $29,999
- 132$30,000 to $34,999
- 9$35,000 to $39,999
- 59$40,000 to $49,999
- 303$50,000 to $59,999
- 715$60,000 to $69,999
- 585$70,000 to $79,999
- 743$80,000 to $89,999
- 638$90,000 to $99,999
- 1,482$100,000 to $124,999
- 973$125,000 to $149,999
- 1,579$150,000 to $174,999
- 866$175,000 to $199,999
- 782$200,000 to $249,999
- 385$250,000 to $299,999
- 645$300,000 to $399,999
- 205$400,000 to $499,999
- 141$500,000 to $749,999
- 26$750,000 to $999,999
- 30$1,000,000 to $1,499,999
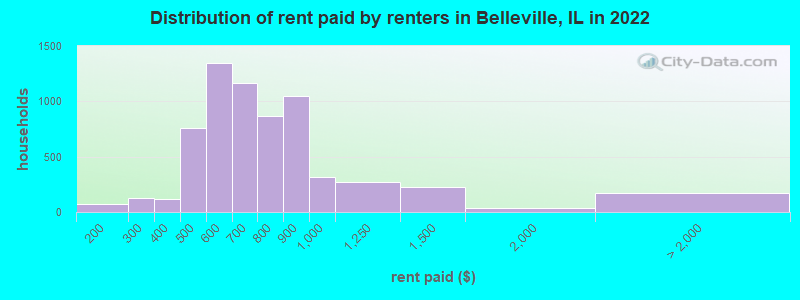
Rent paid by renters in 2022 in Belleville, IL
-
- 27$100 to $149
- 46$150 to $199
- 104$200 to $249
- 26$250 to $299
- 42$300 to $349
- 70$350 to $399
- 289$400 to $449
- 470$450 to $499
- 1,028$500 to $549
- 315$550 to $599
- 530$600 to $649
- 639$650 to $699
- 340$700 to $749
- 524$750 to $799
- 1,050$800 to $899
- 315$900 to $999
- 270$1,000 to $1,249
- 229$1,250 to $1,499
- 32$1,500 to $1,999
- 38$2,000 to $2,499
- 34$3,000 to $3,499
- 95No cash rent
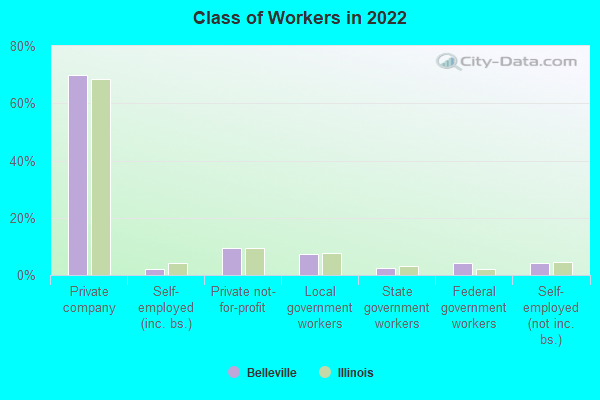
Percentage of workers working in this county: 69.4%
Number of people working at home: 2,717 (13.9% of all workers)
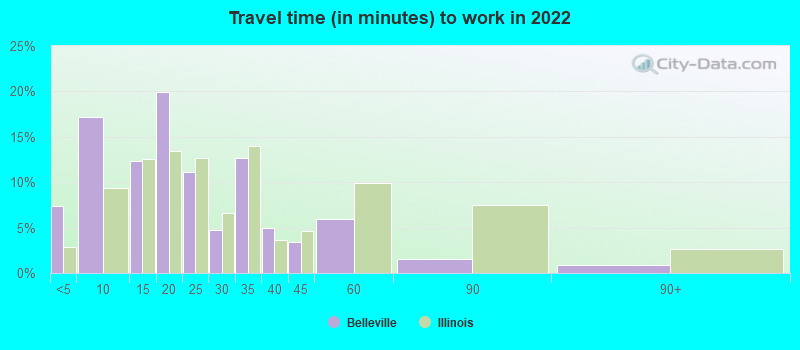
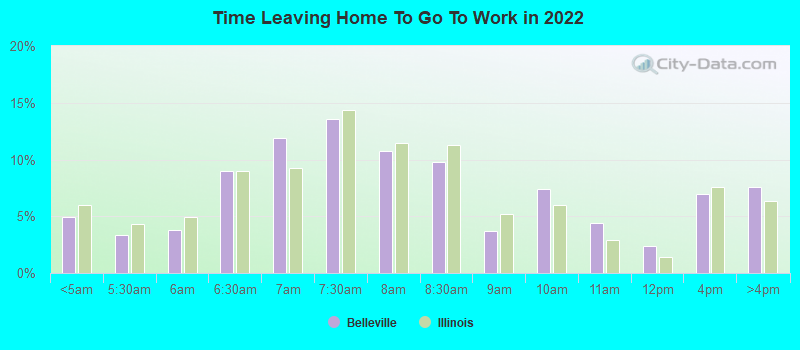
Travel time to work (commute)
- Less than 5 minutes: 901
- 5 to 9 minutes: 2,272
- 10 to 14 minutes: 2,215
- 15 to 19 minutes: 2,657
- 20 to 24 minutes: 2,035
- 25 to 29 minutes: 1,229
- 30 to 34 minutes: 1,880
- 35 to 39 minutes: 1,119
- 40 to 44 minutes: 679
- 45 to 59 minutes: 954
- 60 to 89 minutes: 452
- 90 or more minutes: 459
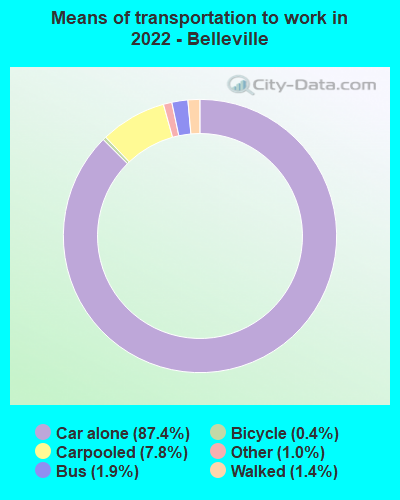
Means of transportation to work:
- Drove a car alone: 15,795 (72.7%)
- Carpooled: 1,696 (7.8%)
- Bus: 225 (1.0%)
- Light rail, streetcar or trolley: 30 (0.1%)
- Taxi: 293 (1.3%)
- Bicycle: 80 (0.4%)
- Walked: 491 (2.3%)
- Worked at home: 2,717 (12.5%)
- Unemployment by race in 2022
- Unemployment rate for White non-Hispanic residents
- 4.0%Males
- 2.3%Females
- Unemployment rate for Black residents
- 22.5%Males
- 15.2%Females
- Unemployment rate for two or more race residents
- 2.7%Males
- 1.5%Females
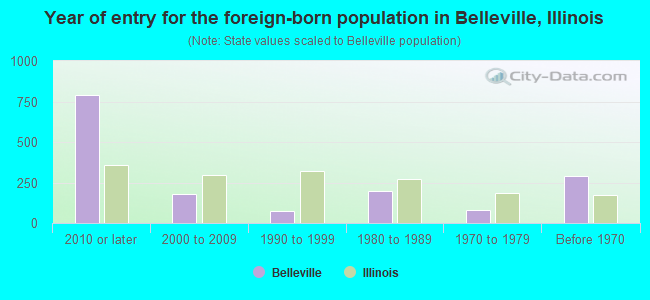
- Year of entry for the foreign-born population in Belleville, Illinois
- 7882010 or later
- 1802000 to 2009
- 741990 to 1999
- 1991980 to 1989
- 791970 to 1979
- 289Before 1970
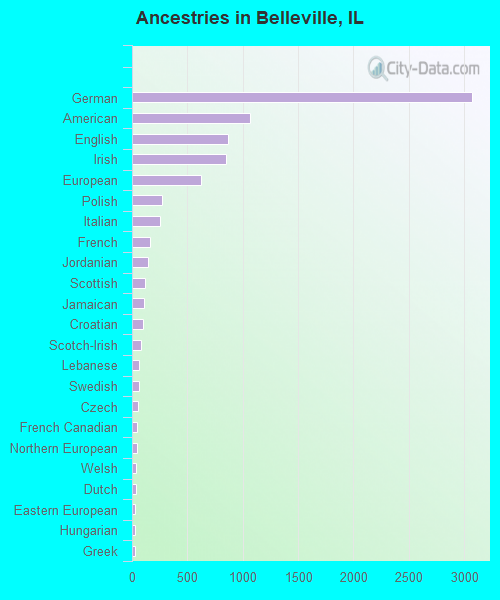
First ancestries reported:
- German: 3,070 (15.9%)
- American: 1,064 (5.5%)
- English: 871 (4.5%)
- Irish: 851 (4.4%)
- European: 626 (3.2%)
- Polish: 269 (1.4%)
- Italian: 254 (1.3%)
- French: 162 (0.8%)
- Jordanian: 140 (0.7%)
- Scottish: 114 (0.6%)
- Jamaican: 104 (0.5%)
- Croatian: 98 (0.5%)
- Scotch-Irish: 78 (0.4%)
- Lebanese: 63 (0.3%)
- Swedish: 62 (0.3%)
- Czech: 51 (0.3%)
- French Canadian: 44 (0.2%)
- Northern European: 42 (0.2%)
- Welsh: 39 (0.2%)
- Dutch: 35 (0.2%)
- Eastern European: 31 (0.2%)
- Hungarian: 30 (0.2%)
- Greek: 28 (0.1%)
- Guyanese: 25 (0.1%)
- British: 24 (0.1%)
- African: 22 (0.1%)
- Slavic: 19 (0.10%)
- Norwegian: 16 (0.08%)
- Scandinavian: 15 (0.08%)
- Luxembourger: 13 (0.07%)
- Portuguese: 13 (0.07%)
- Russian: 6 (0.03%)
- Turkish: 6 (0.03%)
- Lithuanian: 3 (0.02%)
Most common places of birth for foreign-born residents (%):
| Belleville: | 21.0% (266) |
| Illinois: | 34.7% (626,958) |
| Belleville: | 15.9% (202) |
| Illinois: | 0.5% (8,827) |
| Belleville: | 7.5% (95) |
| Illinois: | 0.5% (8,168) |
| Belleville: | 6.5% (82) |
| Illinois: | 0.2% (3,231) |
| Belleville: | 6.2% (79) |
| Illinois: | 5.2% (93,003) |
| Belleville: | 5.6% (71) |
| Illinois: | 9.2% (166,409) |
| Belleville: | 4.9% (62) |
| Illinois: | 0.1% (1,630) |
| Belleville: | 4.6% (58) |
| Illinois: | 4.1% (74,364) |
| Belleville: | 2.8% (36) |
| Illinois: | 1.1% (19,306) |
| Belleville: | 2.4% (31) |
| Illinois: | 0.5% (9,671) |
| Belleville: | 2.2% (28) |
| Illinois: | 1.0% (18,753) |
| Belleville: | 2.1% (27) |
| Illinois: | 0.6% (10,943) |
| Belleville: | 2.0% (25) |
| Illinois: | 0.1% (1,178) |
| Belleville: | 1.7% (22) |
| Illinois: | 0.1% (1,305) |
Place of birth for U.S.-born residents:
- This state: 27,162
- Other state: 12,876
- Northeast: 692
- Midwest: 7,657
- South: 2,777
- West: 1,599
88.5% of Belleville residents lived in the same house 1 years ago.
Out of people who lived in different houses, 37.8% lived in this county.
Out of people who lived in different counties, 45.5% lived in Illinois.
| Belleville: | 88.5% |
| State average: | 88.3% |
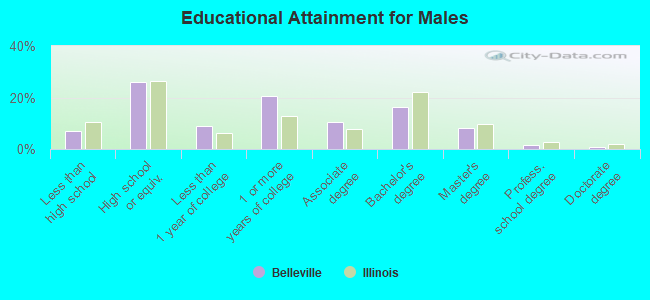
Education attainment for males 25 years and older:
- No schooling: 160
- Nursery to 4th grade: 0
- 5th and 6th grade: 0
- 7th and 8th grade: 116
- 9th grade: 104
- 10th grade: 74
- 11th grade: 158
- 12th grade, no diploma: 345
- High school graduate (or equivalency): 3,530
- Less than 1 year of college: 1,232
- Some college more than 1 year, no degree: 2,776
- Associate degree: 1,425
- Bachelor's degree: 2,210
- Master's degree: 1,117
- Professional school degree: 196
- Doctorate degree: 123
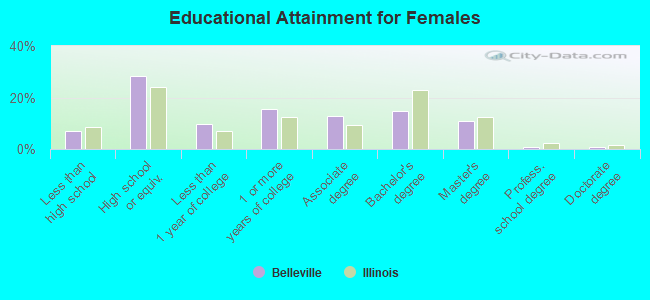
Education attainment for females 25 years and older:
- No schooling: 259
- Nursery to 4th grade: 0
- 5th and 6th grade: 4
- 7th and 8th grade: 77
- 9th grade: 71
- 10th grade: 180
- 11th grade: 298
- 12th grade, no diploma: 155
- High school graduate (or equivalency): 4,286
- Less than 1 year of college: 1,441
- Some college more than 1 year, no degree: 2,320
- Associate degree: 1,908
- Bachelor's degree: 2,234
- Master's degree: 1,645
- Professional school degree: 114
- Doctorate degree: 119
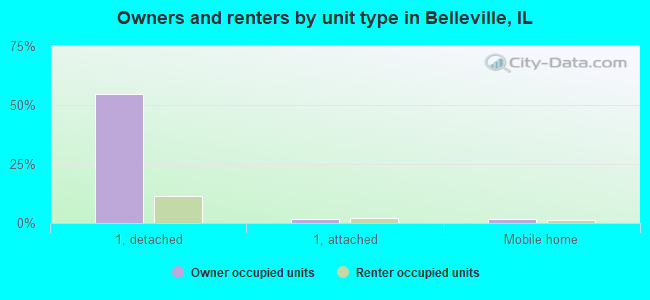
Housing units in structures:
- One, detached: 13,330
- One, attached: 853
- Two: 1,199
- 3 or 4: 1,297
- 5 to 9: 1,716
- 10 to 19: 944
- 20 to 49: 253
- 50 or more: 205
- Mobile homes: 612
Median worth of mobile homes: $21,969
Housing units lacking complete kitchen facilities in 2022: 3.8%
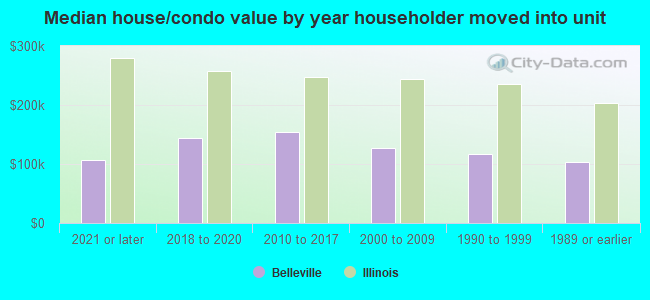
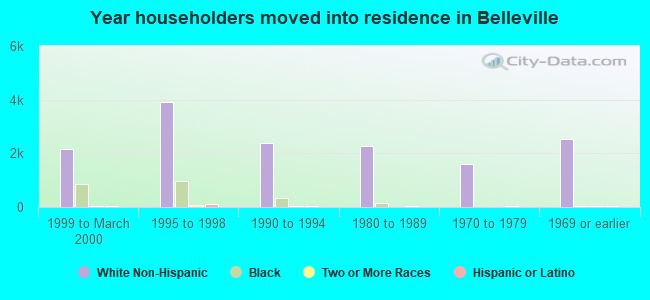
House/condo owner moved in on average 12 years ago
Renter moved in on average 3 years ago
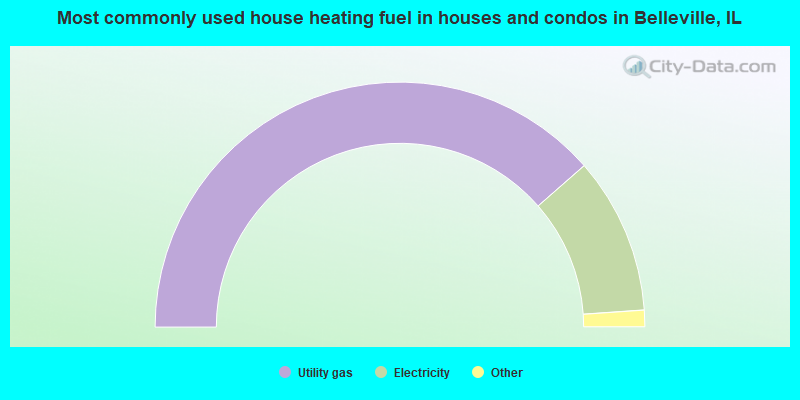
- 77.1%Utility gas
- 20.7%Electricity
- 1.3%Bottled, tank, or LP gas
- 0.5%No fuel used
- 0.2%Wood
- 0.2%Other fuel
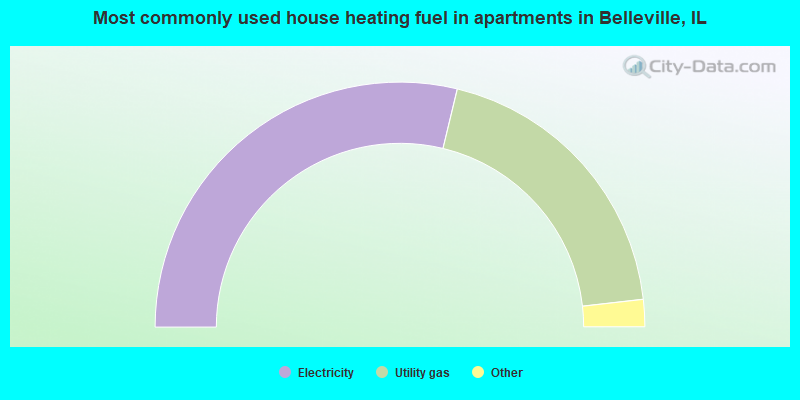
- 57.6%Electricity
- 38.9%Utility gas
- 2.5%Bottled, tank, or LP gas
- 0.7%No fuel used
- 0.3%Other fuel
- 0.2%Wood
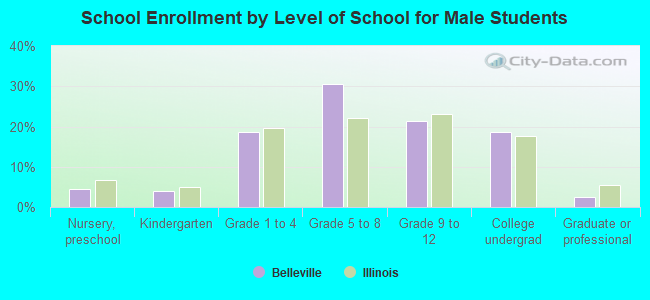
Private vs. public school enrollment:
| Here: | 7.1% |
| Illinois: | 13.3% |
| Here: | 5.0% |
| Illinois: | 9.9% |
| Here: | 12.7% |
| Illinois: | 27.4% |