Bellevue, WA (Washington) Houses and Residents
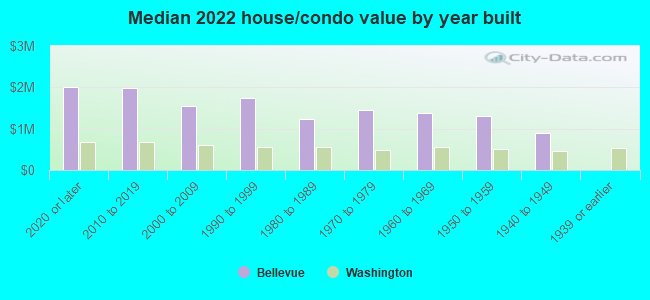
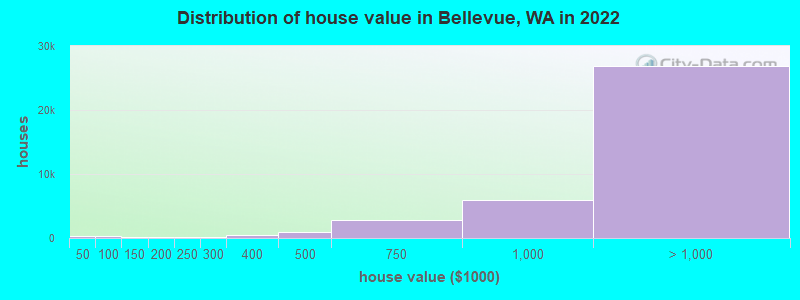
Estimated median house or condo value in 2022: $1,440,300 (it was $287,300 in 2000 )
Bellevue:
$1,440,300Washington:
$569,500
Lower value quartile - upper value quartile: $982,100 - $2,000,001Mean price in 2022: Detached houses: $1,651,695 Here:
$1,651,695State:
$734,307
Townhouses or other attached units: $885,331 Here:
$885,331State:
$657,697
In 2-unit structures: $872,587 Here:
$872,587State:
$534,634
In 3-to-4-unit structures: $522,718 Here:
$522,718State:
$510,239
In 5-or-more-unit structures: $846,916 Here:
$846,916State:
$503,183
Mobile homes: $146,776 Here:
$146,776State:
$218,362
Total population: 136,426 (Urban population: 109,070, Rural population: 119 (all nonfarm) )
Houses: 66,203 (62,394 occupied: 32,855 owner occupied, 29,539 renter occupied )
% of renters here:
47%State:
36%
Housing density: 2,153 houses/condos per square mile
Median price asked for vacant for-sale houses and condos in 2022: $1,018,241.
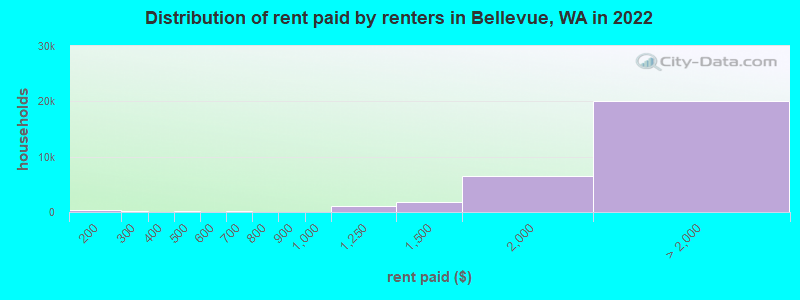
Median contract rent in 2022: over $2,000 (lower quartile is $1,793, upper quartile is over $2,000)
Median rent asked for vacant for-rent units in 2022: $3,164
Median gross rent in Bellevue, WA in 2022: over $2,000
Housing units in Bellevue with a mortgage: 20,276 (1,896 second mortgage, 90 home equity loan, 1,637 both second mortgage and home equity loan )Houses without a mortgage: 538
Median household income for houses/condos with a mortgage: $210,506
Median household income for apartments without a mortgage: $117,473
Median monthly housing costs: $2,491
Data:
Median house or condo value ($)
Median house or condo value ($ change since 2000)
Median house or condo value ($) - White
Median house or condo value ($) - Black or African American
Median house or condo value ($) - Asian
Median house or condo value ($) - Hispanic or Latino
Median house or condo value ($) - American Indian and Alaska Native
Median house or condo value ($) - Multirace
Median house or condo value ($) - Other Race
Median price asked for mobile homes ($)
Household density (households per square mile)
Mean house or condo value by units in structure - 1, detached ($)
Mean house or condo value by units in structure - 1, attached ($)
Mean house or condo value by units in structure - 2 ($)
Mean house or condo value by units in structure by units in structure - 3 or 4 ($)
Mean house or condo value by units in structure - 5 or more ($)
Mean house or condo value by units in structure - Boat, RV, van, etc. ($)
Mean house or condo value by units in structure - Mobile home ($)
Median contract rent ($)
Median contract rent - Lower quartile ($)
Median contract rent - Upper quartile ($)
Median gross rent ($)
Urban houses (%)
Rural houses (%)
Houses occupied (%)
Houses occupied (% change since 2000)
Houses owner occupied (%)
Houses owner occupied (% change since 2000)
Houses renter occupied (%)
Houses renter occupied (% change since 2000)
Vacant housing units - For rent (%)
Vacant housing units - For rent (% change since 2000)
Vacant housing units - For sale only (%)
Vacant housing units - For sale only (% change since 2000)
Vacant housing units - Rented or sold, not occupied (%)
Vacant housing units - Rented or sold, not occupied (% change since 2000)
Vacant housing units - For seasonal, recreational, or occasional use (%)
Vacant housing units - For seasonal, recreational, or occasional use (% change since 2000)
Vacant housing units - For migrant workers (%)
Vacant housing units - For migrant workers (% change since 2000)
Vacant housing units - Other vacant (%)
Vacant housing units - Other vacant (% change since 2000)
Median monthly housing costs ($)
Median household income for houses/condos with a mortgage ($)
Median household income for houses/condos without a mortgage ($)
Median household income ($)
Median household income ($) - White
Median household income ($) - Black or African American
Median household income ($) - Asian
Median household income ($) - Hispanic or Latino
Median household income ($) - American Indian and Alaska Native
Median household income ($) - Multirace
Median household income ($) - Other Race
Mortgage status - with mortgage (%)
Mortgage status - with second mortgage (%)
Mortgage status - with home equity loan (%)
Mortgage status - with both second mortgage and home equity loan (%)
Mortgage status - without a mortgage (%)
Median year house/condo built
Median year apartment built
Household type by relationship - Male householder living alone (%)
Household type by relationship - Male householder not living alone (%)
Household type by relationship - Female householder living alone (%)
Household type by relationship - Female householder not living alone (%)
Household type by relationship - Opposite-Sex spouse (%)
Household type by relationship - Same-Sex spouse (%)
Household type by relationship - Opposite-Sex unmarried partner (%)
Household type by relationship - Same-Sex unmarried partner (%)
Household type by relationship - In group quarters (%)
Size of family households - 2-person household (%)
Size of family households - 3-person household (%)
Size of family households - 4-person household (%)
Size of family households - 5-person household (%)
Size of family households - 6-person household (%)
Size of family households - 7-or-more-person household (%)
Size of nonfamily households - 1-person household (%)
Size of nonfamily households - 2-person household (%)
Size of nonfamily households - 3-person household (%)
Size of nonfamily households - 4-person household (%)
Size of nonfamily households - 5-person household (%)
Size of nonfamily households - 6-person household (%)
Size of nonfamily households - 7-or-moreperson household (%)
Year house built - Built 2010 or later (%)
Year house built - Built 2000 to 2009 (%)
Year house built - Built 1990 to 1999 (%)
Year house built - Built 1980 to 1989 (%)
Year house built - Built 1970 to 1979 (%)
Year house built - Built 1960 to 1969 (%)
Year house built - Built 1950 to 1959 (%)
Year house built - Built 1940 to 1949 (%)
Year house built - Built 1939 or earlier (%)
Median number of rooms in houses and condos
Median number of rooms in apartments
Median number of bedrooms in owner occupied houses
Mean number of bedrooms in owner occupied houses
Median number of bedrooms in renter occupied houses
Mean number of bedrooms in renter occupied houses
Median number of vehichles in owner occupied houses
Mean number of vehichles in owner occupied houses
Median number of vehichles in renter occupied houses
Mean number of vehichles in renter occupied houses
Rooms in owner-occupied houses - 1 room (%)
Rooms in owner-occupied houses - 2 rooms (%)
Rooms in owner-occupied houses - 3 rooms (%)
Rooms in owner-occupied houses - 4 rooms (%)
Rooms in owner-occupied houses - 5 rooms (%)
Rooms in owner-occupied houses - 6 rooms (%)
Rooms in owner-occupied houses - 7 rooms (%)
Rooms in owner-occupied houses - 8 rooms (%)
Rooms in owner-occupied houses - 9+ rooms (%)
Rooms in renter-occupied houses - 1 room (%)
Rooms in renter-occupied houses - 2 rooms (%)
Rooms in renter-occupied houses - 3 rooms (%)
Rooms in renter-occupied houses - 4 rooms (%)
Rooms in renter-occupied houses - 5 rooms (%)
Rooms in renter-occupied houses - 6 rooms (%)
Rooms in renter-occupied houses - 7 rooms (%)
Rooms in renter-occupied houses - 8 rooms (%)
Rooms in renter-occupied houses - 9+ rooms (%)
Bedrooms in owner-occupied houses - no bedrooms (%)
Bedrooms in owner-occupied houses - 1 bedroom (%)
Bedrooms in owner-occupied houses - 2 bedrooms (%)
Bedrooms in owner-occupied houses - 3 bedrooms (%)
Bedrooms in owner-occupied houses - 4 bedrooms (%)
Bedrooms in owner-occupied houses - 5+ bedrooms (%)
Bedrooms in renter-occupied houses - no bedrooms (%)
Bedrooms in renter-occupied houses - 1 bedroom (%)
Bedrooms in renter-occupied houses - 2 bedrooms (%)
Bedrooms in renter-occupied houses - 3 bedrooms (%)
Bedrooms in renter-occupied houses - 4 bedrooms (%)
Bedrooms in renter-occupied houses - 5+ bedrooms (%)
Vehicles available in owner-occupied houses - no vehicle available (%)
Vehicles available in owner-occupied houses - 1 vehicle available(%)
Vehicles available in owner-occupied houses - 2 Vehicles available (%)
Vehicles available in owner-occupied houses - 3 Vehicles available (%)
Vehicles available in owner-occupied houses - 4 Vehicles available (%)
Vehicles available in owner-occupied houses - 5+ Vehicles available (%)
Vehicles available in renter-occupied houses - no vehicle available (%)
Vehicles available in renter-occupied houses - 1 vehicle available (%)
Vehicles available in renter-occupied houses - 2 Vehicles available (%)
Vehicles available in renter-occupied houses - 3 Vehicles available (%)
Vehicles available in renter-occupied houses - 4 Vehicles available (%)
Vehicles available in renter-occupied houses - 5+ Vehicles available (%)
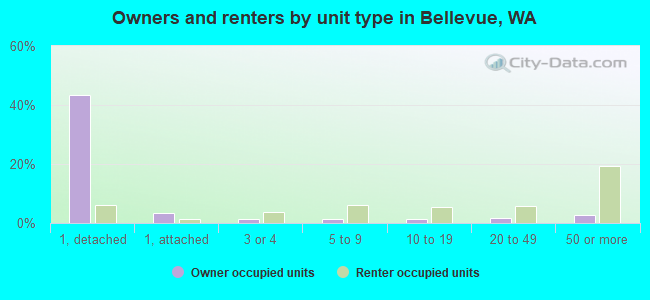
Housing units in structures - 1, detached (%)
Housing units in structures - 1, attached (%)
Housing units in structures - 2 (%)
Housing units in structures - 3 or 4 (%)
Housing units in structures - 5 to 9 (%)
Housing units in structures - 10 to 19 (%)
Housing units in structures - 20 to 49 (%)
Housing units in structures - 50 or more (%)
Housing units in structures - Mobile home (%)
Housing units in structures - Boat, RV, van, etc. (%)
Housing units in structures - Owners - 1, detached (%)
Housing units in structures - Owners - 1, attached (%)
Housing units in structures - Owners - 2 (%)
Housing units in structures - Owners - 3 or 4 (%)
Housing units in structures - Owners - 5 to 9 (%)
Housing units in structures - Owners - 10 to 19 (%)
Housing units in structures - Owners - 20 to 49 (%)
Housing units in structures - Owners - 50 or more (%)
Housing units in structures - Owners - Mobile home (%)
Housing units in structures - Owners - Boat, RV, van, etc. (%)
Housing units in structures - Renters - 1, detached (%)
Housing units in structures - Renters - 1, attached (%)
Housing units in structures - Renters - 2 (%)
Housing units in structures - Renters - 3 or 4 (%)
Housing units in structures - Renters - 5 to 9 (%)
Housing units in structures - Renters - 10 to 19 (%)
Housing units in structures - Renters - 20 to 49 (%)
Housing units in structures - Renters - 50 or more (%)
Housing units in structures - Renters - Mobile home (%)
Housing units in structures - Renters - Boat, RV, van, etc. (%)
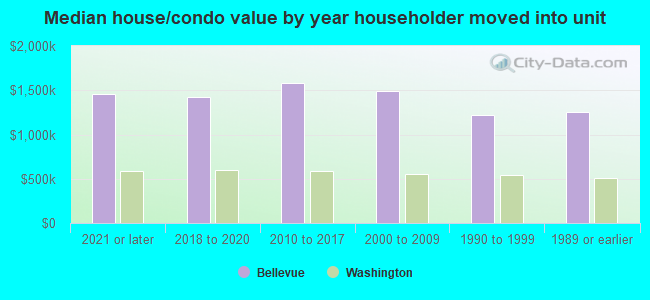
House/condo owner moved in on average (years ago)
Renter moved in on average (years ago)
Year householder moved into unit - Moved in 1999 to March 2000 (%)
Year householder moved into unit - Moved in 1999 to March 2000 (%) - White
Year householder moved into unit - Moved in 1999 to March 2000 (%) - Black or African American
Year householder moved into unit - Moved in 1999 to March 2000 (%) - Asian
Year householder moved into unit - Moved in 1999 to March 2000 (%) - Hispanic or Latino
Year householder moved into unit - Moved in 1999 to March 2000 (%) - American Indian and Alaska Native
Year householder moved into unit - Moved in 1999 to March 2000 (%) - Multirace
Year householder moved into unit - Moved in 1999 to March 2000 (%) - Other Race
Year householder moved into unit - Moved in 1995 to 1998 (%)
Year householder moved into unit - Moved in 1995 to 1998 (%) - White
Year householder moved into unit - Moved in 1995 to 1998 (%) - Black or African American
Year householder moved into unit - Moved in 1995 to 1998 (%) - Asian
Year householder moved into unit - Moved in 1995 to 1998 (%) - Hispanic or Latino
Year householder moved into unit - Moved in 1995 to 1998 (%) - American Indian and Alaska Native
Year householder moved into unit - Moved in 1995 to 1998 (%) - Multirace
Year householder moved into unit - Moved in 1995 to 1998 (%) - Other Race
Year householder moved into unit - Moved in 1990 to 1994 (%)
Year householder moved into unit - Moved in 1990 to 1994 (%) - White
Year householder moved into unit - Moved in 1990 to 1994 (%) - Black or African American
Year householder moved into unit - Moved in 1990 to 1994 (%) - Asian
Year householder moved into unit - Moved in 1990 to 1994 (%) - Hispanic or Latino
Year householder moved into unit - Moved in 1990 to 1994 (%) - American Indian and Alaska Native
Year householder moved into unit - Moved in 1990 to 1994 (%) - Multirace
Year householder moved into unit - Moved in 1990 to 1994 (%) - Other Race
Year householder moved into unit - Moved in 1980 to 1989 (%)
Year householder moved into unit - Moved in 1980 to 1989 (%) - White
Year householder moved into unit - Moved in 1980 to 1989 (%) - Black or African American
Year householder moved into unit - Moved in 1980 to 1989 (%) - Asian
Year householder moved into unit - Moved in 1980 to 1989 (%) - Hispanic or Latino
Year householder moved into unit - Moved in 1980 to 1989 (%) - American Indian and Alaska Native
Year householder moved into unit - Moved in 1980 to 1989 (%) - Multirace
Year householder moved into unit - Moved in 1980 to 1989 (%) - Other Race
Year householder moved into unit - Moved in 1970 to 1979 (%)
Year householder moved into unit - Moved in 1970 to 1979 (%) - White
Year householder moved into unit - Moved in 1970 to 1979 (%) - Black or African American
Year householder moved into unit - Moved in 1970 to 1979 (%) - Asian
Year householder moved into unit - Moved in 1970 to 1979 (%) - Hispanic or Latino
Year householder moved into unit - Moved in 1970 to 1979 (%) - American Indian and Alaska Native
Year householder moved into unit - Moved in 1970 to 1979 (%) - Multirace
Year householder moved into unit - Moved in 1970 to 1979 (%) - Other Race
Year householder moved into unit - Moved in 1969 or earlier (%)
Year householder moved into unit - Moved in 1969 or earlier (%) - White
Year householder moved into unit - Moved in 1969 or earlier (%) - Black or African American
Year householder moved into unit - Moved in 1969 or earlier (%) - Asian
Year householder moved into unit - Moved in 1969 or earlier (%) - Hispanic or Latino
Year householder moved into unit - Moved in 1969 or earlier (%) - American Indian and Alaska Native
Year householder moved into unit - Moved in 1969 or earlier (%) - Multirace
Year householder moved into unit - Moved in 1969 or earlier (%) - Other Race
Housing units lacking complete plumbing facilities (%)
Housing units lacking complete kitchen facilities (%)
House heating fuel used in houses and condos - Utility gas (%)
House heating fuel used in houses and condos - Bottled, tank, or LP gas (%)
House heating fuel used in houses and condos - Electricity (%)
House heating fuel used in houses and condos - Fuel oil, kerosene, etc. (%)
House heating fuel used in houses and condos - Coal or coke (%)
House heating fuel used in houses and condos - Wood (%)
House heating fuel used in houses and condos - Solar energy (%)
House heating fuel used in houses and condos - Other fuel (%)
House heating fuel used in houses and condos - No fuel used (%)
House heating fuel used in apartments - Utility gas (%)
House heating fuel used in apartments - Bottled, tank, or LP gas (%)
House heating fuel used in apartments - Electricity (%)
House heating fuel used in apartments - Fuel oil, kerosene, etc. (%)
House heating fuel used in apartments - Coal or coke (%)
House heating fuel used in apartments - Wood (%)
House heating fuel used in apartments - Solar energy (%)
House heating fuel used in apartments - Other fuel (%)
House heating fuel used in apartments - No fuel used (%)
Latest news about housing in Bellevue, WA collected exclusively by city-data.com from local newspapers, TV, and radio stations
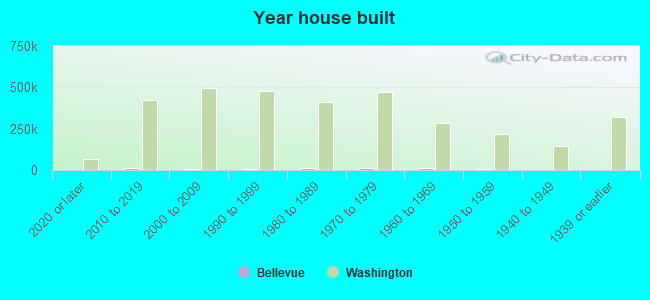
Median year house/condo built: 1975Median year apartment built: 1994Household type by relationship:
Households: 152,765
Male householders: 38,457 (8,645 living alone ), Female householders: 23,937 (6,896 living alone )34,814 spouses (34,428 opposite-sex spouses ), 4,102 unmarried partners , (3,615 opposite-sex unmarried partners ), 37,880 children (36,397 natural , 735 adopted , 748 stepchildren ), 588 grandchildren , 790 brothers or sisters , 1,642 parents , 0 foster children , 2,211 other relatives , 6,652 non-relatives In group quarters: 1,692
Size of family households: 17,624 2-persons , 10,316 3-persons , 9,947 4-persons , 2,327 5-persons , 324 6-persons , 260 7-or-more-persons .
Size of nonfamily households: 15,541 1-person , 5,054 2-persons , 881 3-persons , 120 4-persons .
24,394 married couples with children. single-parent households (590 men , 3,455 women ).
50.4% of residents of Bellevue speak English at home. of residents speak Spanish at home (61% speak English very well , 23% speak English well , 13% speak English not well , 3% don't speak English at all ).of residents speak other Indo-European language at home (83% speak English very well , 13% speak English well , 4% speak English not well ).of residents speak Asian or Pacific Island language at home (63% speak English very well , 24% speak English well , 11% speak English not well , 2% don't speak English at all ).of residents speak other language at home (95% speak English very well , 5% speak English well ).
Foreign born population: 65,887 (43.1%)of them are naturalized citizens )
Median number of rooms in houses and condos:
Median number of rooms in apartments
Owner-occupied Renter-occupied
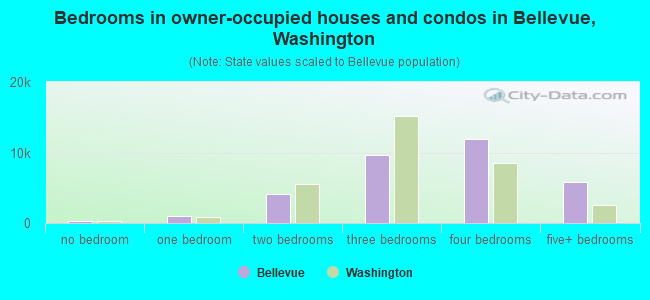
Bedrooms in owner-occupied houses and condos in Bellevue, Washington
321 no bedroom 1,007 1 bedroom 4,083 2 bedrooms 9,646 3 bedrooms 11,955 4 bedrooms 5,843 5+ bedrooms
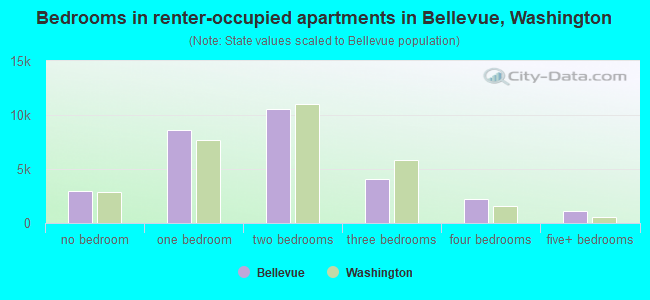
Bedrooms in renter-occupied apartments in Bellevue, Washington
3,005 no bedroom 8,641 1 bedroom 10,530 2 bedrooms 4,035 3 bedrooms 2,250 4 bedrooms 1,078 5+ bedrooms
Owner-occupied Renter-occupied
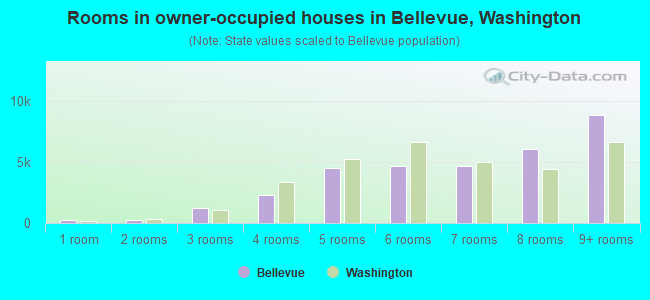
Rooms in owner-occupied houses in Bellevue, Washington
275 1 room 279 2 rooms 1,209 3 rooms 2,287 4 rooms 4,524 5 rooms 4,704 6 rooms 4,649 7 rooms 6,077 8 rooms 8,851 9+ rooms
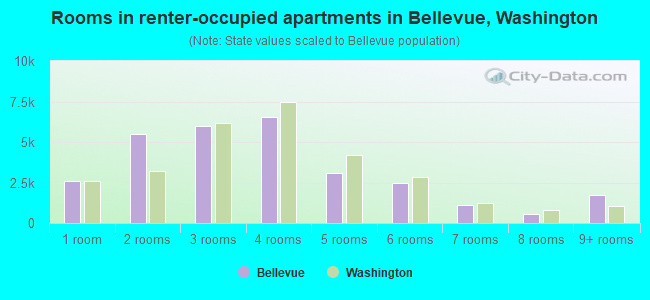
Rooms in renter-occupied apartments in Bellevue, Washington
2,596 1 room 5,481 2 rooms 5,967 3 rooms 6,539 4 rooms 3,069 5 rooms 2,486 6 rooms 1,101 7 rooms 575 8 rooms 1,725 9+ rooms
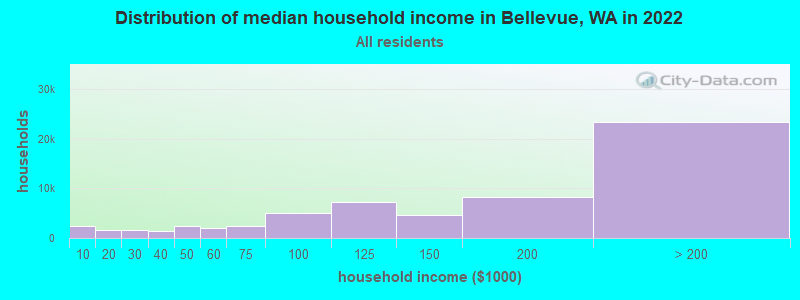
Bellevue, WA household income distribution 2,332 Less than $10,0001,633 $10,000 to $19,9991,561 $20,000 to $29,9991,496 $30,000 to $39,9992,447 $40,000 to $49,9992,055 $50,000 to $59,9992,475 $60,000 to $74,9994,965 $75,000 to $99,9997,154 $100,000 to $124,9994,595 $125,000 to $149,9998,315 $150,000 to $199,99923,366 $200,000 or more
Home value of owner - occupied houses in 2022 in Bellevue, WA 211 Less than $10,00027 $10,000 to $14,99920 $15,000 to $19,9993 $20,000 to $24,99919 $30,000 to $34,99926 $40,000 to $49,99949 $50,000 to $59,999133 $60,000 to $69,99939 $80,000 to $89,999113 $100,000 to $124,99923 $125,000 to $149,99939 $150,000 to $174,99944 $175,000 to $199,99992 $200,000 to $249,999111 $250,000 to $299,999432 $300,000 to $399,999939 $400,000 to $499,9992,746 $500,000 to $749,9995,957 $750,000 to $999,99911,043 $1,000,000 to $1,499,9997,183 $1,500,000 to $1,999,9998,676 $2,000,000 or moreRent paid by renters in 2022 in Bellevue, WA 26 Less than $100261 $100 to $149181 $150 to $199204 $200 to $24956 $250 to $29916 $300 to $34913 $350 to $39956 $400 to $44937 $450 to $49927 $550 to $599104 $600 to $649112 $650 to $69945 $700 to $74912 $750 to $79967 $800 to $89972 $900 to $9991,050 $1,000 to $1,2491,778 $1,250 to $1,4996,505 $1,500 to $1,9997,574 $2,000 to $2,4994,542 $2,500 to $2,9993,169 $3,000 to $3,4993,892 $3,500 or more873 No cash rent
Percentage of workers working in this county: 97.6%Number of people working at home: 32,045 (38.6% of all workers )
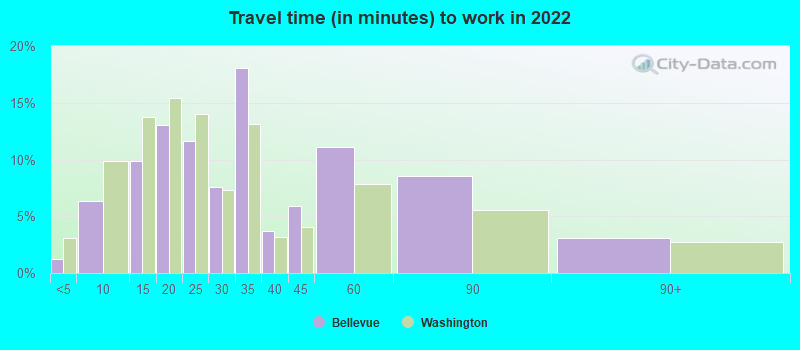
Travel time to work (commute)
Less than 5 minutes: 7335 to 9 minutes: 4,03510 to 14 minutes: 7,58315 to 19 minutes: 10,54920 to 24 minutes: 9,64625 to 29 minutes: 3,30830 to 34 minutes: 5,97635 to 39 minutes: 2,53240 to 44 minutes: 1,93445 to 59 minutes: 2,10160 to 89 minutes: 1,76090 or more minutes: 716
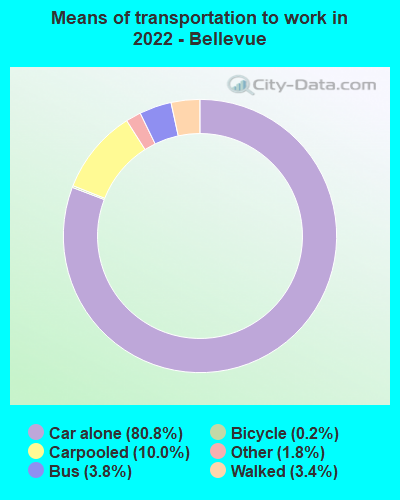
Means of transportation to work:
Drove a car alone: 74,603 (60.0%)Carpooled: 9,234 (7.4%)Bus : 3,541 (2.8%)Ferryboat: 17 (0.0%)Taxi: 1,678 (1.3%)Bicycle: 188 (0.2%)Walked: 3,100 (2.5%)Worked at home: 32,045 (25.8%)
Unemployment by race in 2022
Unemployment rate for White non-Hispanic residents 2.0% Males3.4% FemalesUnemployment rate for Black residents 4.9% Males3.6% FemalesUnemployment rate for Asian residents 0.9% Males4.3% FemalesUnemployment rate for other race residents 3.5% Males3.9% FemalesUnemployment rate for two or more race residents 5.3% Males7.1% FemalesUnemployment rate for Hispanic or Latino residents 3.1% Males5.3% Females
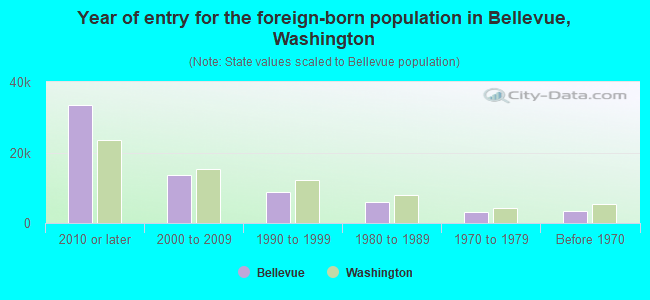
Year of entry for the foreign-born population in Bellevue, Washington
33,478 2010 or later 13,618 2000 to 2009 8,916 1990 to 1999 6,039 1980 to 1989 2,993 1970 to 1979 3,442 Before 1970
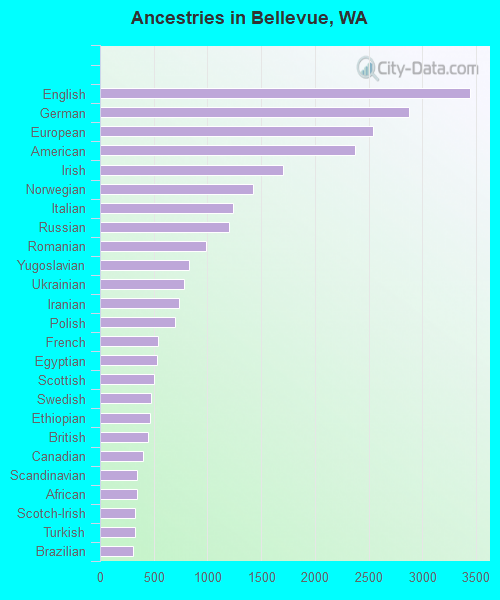
First ancestries reported:
English: 3,447 (3.7%)
German: 2,871 (3.0%)
European: 2,538 (2.7%)
American: 2,373 (2.5%)
Irish: 1,703 (1.8%)
Norwegian: 1,427 (1.5%)
Italian: 1,241 (1.3%)
Russian: 1,200 (1.3%)
Romanian: 986 (1.0%)
Yugoslavian: 826 (0.9%)
Ukrainian: 777 (0.8%)
Iranian: 731 (0.8%)
Polish: 702 (0.7%)
French: 544 (0.6%)
Egyptian: 531 (0.6%)
Scottish: 505 (0.5%)
Swedish: 474 (0.5%)
Ethiopian: 468 (0.5%)
British: 448 (0.5%)
Canadian: 401 (0.4%)
Scandinavian: 348 (0.4%)
African: 341 (0.4%)
Scotch-Irish: 324 (0.3%)
Turkish: 321 (0.3%)
Brazilian: 303 (0.3%)
Danish: 294 (0.3%)
Moroccan: 291 (0.3%)
Portuguese: 288 (0.3%)
Northern European: 277 (0.3%)
Armenian: 245 (0.3%)
Jamaican: 236 (0.3%)
Serbian: 234 (0.2%)
Dutch: 230 (0.2%)
Eastern European: 174 (0.2%)
Israeli: 155 (0.2%)
Welsh: 155 (0.2%)
Czech: 153 (0.2%)
French Canadian: 143 (0.2%)
Slovak: 130 (0.1%)
Swiss: 129 (0.1%)
Bulgarian: 127 (0.1%)
Belgian: 120 (0.1%)
Nigerian: 98 (0.1%)
Latvian: 91 (0.10%)
Somali: 89 (0.09%)
Hungarian: 79 (0.08%)
Greek: 62 (0.07%)
Lebanese: 54 (0.06%)
Austrian: 53 (0.06%)
Australian: 49 (0.05%)
Finnish: 47 (0.05%)
Jordanian: 44 (0.05%)
Sudanese: 40 (0.04%)
Icelander: 38 (0.04%)
Guyanese: 37 (0.04%)
Palestinian: 31 (0.03%)
Croatian: 29 (0.03%)
Haitian: 27 (0.03%)
Estonian: 25 (0.03%)
Kenyan: 22 (0.02%)
Assyrian: 20 (0.02%)
Ugandan: 16 (0.02%)
Lithuanian: 11 (0.01%)
South African: 11 (0.01%)
Afghan: 10 (0.01%)
New Zealander: 7 (0.01%)
Slovene: 6 (0.01%)
West Indian: 5 (0.01%)
Most common places of birth for foreign-born residents (%): India Bellevue:
27.2% (17,459)Washington:
8.9% (101,353)
China, excluding Hong Kong and Taiwan Bellevue:
20.5% (13,164)Washington:
7.4% (84,470)
Korea Bellevue:
5.8% (3,751)Washington:
4.3% (48,886)
Mexico Bellevue:
4.8% (3,105)Washington:
21.1% (241,655)
Vietnam Bellevue:
3.9% (2,484)Washington:
5.4% (62,003)
Taiwan Bellevue:
3.5% (2,234)Washington:
1.5% (16,607)
Canada Bellevue:
3.0% (1,943)Washington:
4.1% (47,238)
Japan Bellevue:
2.6% (1,670)Washington:
1.5% (17,453)
Russia Bellevue:
2.2% (1,408)Washington:
1.9% (21,540)
Hong Kong Bellevue:
2.1% (1,373)Washington:
0.8% (8,785)
Thailand Bellevue:
1.8% (1,127)Washington:
0.9% (9,937)
Place of birth for U.S.-born residents:
This state: 41,872Other state: 41,485Northeast: 6,305Midwest: 9,407South: 8,312West: 17,461 81.5% of Bellevue residents lived in the same house 1 years ago.
Out of people who lived in different houses, 39.3% lived in this county.
Out of people who lived in different counties, 6.3% lived in Washington.
Bellevue:
81.5%State average:
85.2%
Education attainment for males 25 years and older:
No schooling: 448Nursery to 4th grade: 855th and 6th grade: 5107th and 8th grade: 2319th grade: 9010th grade: 24211th grade: 7812th grade, no diploma: 830High school graduate (or equivalency): 4,334Less than 1 year of college: 751Some college more than 1 year, no degree: 4,552Associate degree: 2,021Bachelor's degree: 21,703Master's degree: 18,153Professional school degree: 2,498Doctorate degree: 2,890
Education attainment for females 25 years and older:
No schooling: 425Nursery to 4th grade: 165th and 6th grade: 7657th and 8th grade: 1569th grade: 910th grade: 7011th grade: 37312th grade, no diploma: 1,012High school graduate (or equivalency): 4,126Less than 1 year of college: 2,069Some college more than 1 year, no degree: 6,605Associate degree: 3,103Bachelor's degree: 18,738Master's degree: 12,335Professional school degree: 2,607Doctorate degree: 2,141
Housing units in structures:
One, detached: 33,012One, attached: 3,375Two: 6513 or 4: 2,4255 to 9: 4,19710 to 19: 3,49020 to 49: 4,78650 or more: 14,178Mobile homes: 89Housing units lacking complete plumbing facilities in 2022: 0.1%Housing units lacking complete kitchen facilities in 2022: 1.8%House/condo owner moved in on average 12 years ago
Renter moved in on average 1 years ago
Private vs. public school enrollment:
Students in private schools in grades 1 to 8 (elementary and middle school): 1,874 Here:
14.4%Washington:
12.4%
Students in private schools in grades 9 to 12 (high school): 1,136 Here:
12.0%Washington:
9.2%
Students in private undergraduate colleges: 1,086 Here:
22.5%Washington:
16.5%