Berwyn, IL (Illinois) Houses and Residents
Estimated median house or condo value in 2022: $280,055 (it was $137,400 in 2000 )
Berwyn:
$280,055Illinois:
$251,600
Lower value quartile - upper value quartile: $229,706 - $341,882Mean price in 2022: Detached houses: $281,849 Here:
$281,849State:
$310,164
Townhouses or other attached units: $394,988 Here:
$394,988State:
$286,230
In 2-unit structures: $252,987 Here:
$252,987State:
$299,638
In 3-to-4-unit structures: $316,607 Here:
$316,607State:
$330,907
In 5-or-more-unit structures: $183,448 Here:
$183,448State:
$318,887
Mobile homes: $186,095 Here:
$186,095State:
$78,855
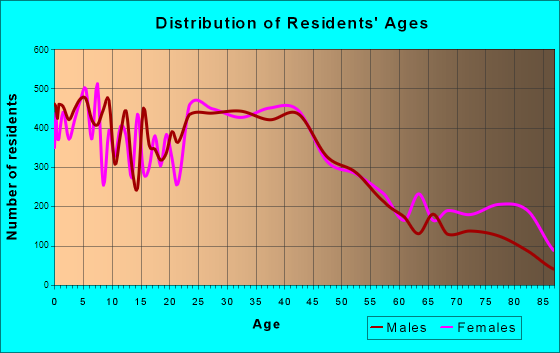
Total population: 56,693 (Urban population: 54,016, Rural population: 0)
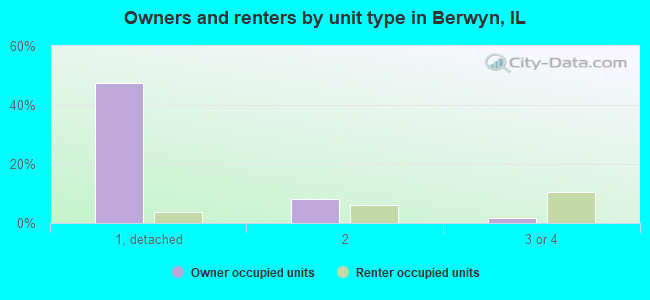
Houses: 21,743 (19,988 occupied: 12,288 owner occupied, 8,041 renter occupied )
% of renters here:
40%State:
33%
Housing density: 5,586 houses/condos per square mile
Median price asked for vacant for-sale houses and condos in 2022: $225,627.
Median contract rent in 2022: $983 (lower quartile is $856, upper quartile is $1,242)
Median rent asked for vacant for-rent units in 2022: $1,064
Median gross rent in Berwyn, IL in 2022: $1,100
Housing units in Berwyn with a mortgage: 8,151 (500 second mortgage, 56 home equity loan, 317 both second mortgage and home equity loan )Houses without a mortgage: 352
Median household income for houses/condos with a mortgage: $98,193
Median household income for apartments without a mortgage: $74,142
Median monthly housing costs: $1,298
Data:
Median house or condo value ($)
Median house or condo value ($ change since 2000)
Median house or condo value ($) - White
Median house or condo value ($) - Black or African American
Median house or condo value ($) - Asian
Median house or condo value ($) - Hispanic or Latino
Median house or condo value ($) - American Indian and Alaska Native
Median house or condo value ($) - Multirace
Median house or condo value ($) - Other Race
Median price asked for mobile homes ($)
Household density (households per square mile)
Mean house or condo value by units in structure - 1, detached ($)
Mean house or condo value by units in structure - 1, attached ($)
Mean house or condo value by units in structure - 2 ($)
Mean house or condo value by units in structure by units in structure - 3 or 4 ($)
Mean house or condo value by units in structure - 5 or more ($)
Mean house or condo value by units in structure - Boat, RV, van, etc. ($)
Mean house or condo value by units in structure - Mobile home ($)
Median contract rent ($)
Median contract rent - Lower quartile ($)
Median contract rent - Upper quartile ($)
Median gross rent ($)
Urban houses (%)
Rural houses (%)
Houses occupied (%)
Houses occupied (% change since 2000)
Houses owner occupied (%)
Houses owner occupied (% change since 2000)
Houses renter occupied (%)
Houses renter occupied (% change since 2000)
Vacant housing units - For rent (%)
Vacant housing units - For rent (% change since 2000)
Vacant housing units - For sale only (%)
Vacant housing units - For sale only (% change since 2000)
Vacant housing units - Rented or sold, not occupied (%)
Vacant housing units - Rented or sold, not occupied (% change since 2000)
Vacant housing units - For seasonal, recreational, or occasional use (%)
Vacant housing units - For seasonal, recreational, or occasional use (% change since 2000)
Vacant housing units - For migrant workers (%)
Vacant housing units - For migrant workers (% change since 2000)
Vacant housing units - Other vacant (%)
Vacant housing units - Other vacant (% change since 2000)
Median monthly housing costs ($)
Median household income for houses/condos with a mortgage ($)
Median household income for houses/condos without a mortgage ($)
Median household income ($)
Median household income ($) - White
Median household income ($) - Black or African American
Median household income ($) - Asian
Median household income ($) - Hispanic or Latino
Median household income ($) - American Indian and Alaska Native
Median household income ($) - Multirace
Median household income ($) - Other Race
Mortgage status - with mortgage (%)
Mortgage status - with second mortgage (%)
Mortgage status - with home equity loan (%)
Mortgage status - with both second mortgage and home equity loan (%)
Mortgage status - without a mortgage (%)
Median year house/condo built
Median year apartment built
Household type by relationship - Male householder living alone (%)
Household type by relationship - Male householder not living alone (%)
Household type by relationship - Female householder living alone (%)
Household type by relationship - Female householder not living alone (%)
Household type by relationship - Opposite-Sex spouse (%)
Household type by relationship - Same-Sex spouse (%)
Household type by relationship - Opposite-Sex unmarried partner (%)
Household type by relationship - Same-Sex unmarried partner (%)
Household type by relationship - In group quarters (%)
Size of family households - 2-person household (%)
Size of family households - 3-person household (%)
Size of family households - 4-person household (%)
Size of family households - 5-person household (%)
Size of family households - 6-person household (%)
Size of family households - 7-or-more-person household (%)
Size of nonfamily households - 1-person household (%)
Size of nonfamily households - 2-person household (%)
Size of nonfamily households - 3-person household (%)
Size of nonfamily households - 4-person household (%)
Size of nonfamily households - 5-person household (%)
Size of nonfamily households - 6-person household (%)
Size of nonfamily households - 7-or-moreperson household (%)
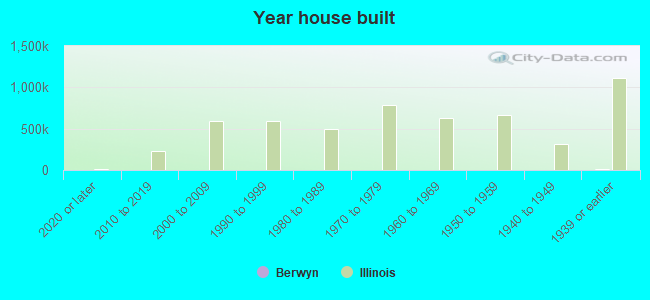
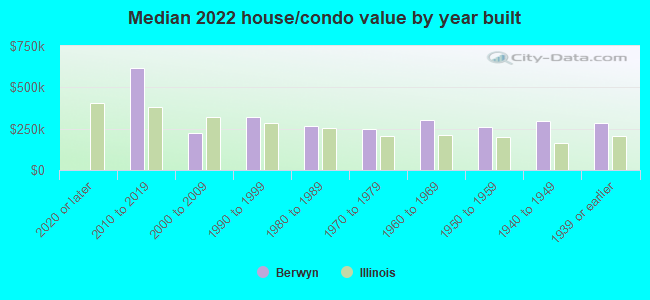
Year house built - Built 2010 or later (%)
Year house built - Built 2000 to 2009 (%)
Year house built - Built 1990 to 1999 (%)
Year house built - Built 1980 to 1989 (%)
Year house built - Built 1970 to 1979 (%)
Year house built - Built 1960 to 1969 (%)
Year house built - Built 1950 to 1959 (%)
Year house built - Built 1940 to 1949 (%)
Year house built - Built 1939 or earlier (%)
Median number of rooms in houses and condos
Median number of rooms in apartments
Median number of bedrooms in owner occupied houses
Mean number of bedrooms in owner occupied houses
Median number of bedrooms in renter occupied houses
Mean number of bedrooms in renter occupied houses
Median number of vehichles in owner occupied houses
Mean number of vehichles in owner occupied houses
Median number of vehichles in renter occupied houses
Mean number of vehichles in renter occupied houses
Rooms in owner-occupied houses - 1 room (%)
Rooms in owner-occupied houses - 2 rooms (%)
Rooms in owner-occupied houses - 3 rooms (%)
Rooms in owner-occupied houses - 4 rooms (%)
Rooms in owner-occupied houses - 5 rooms (%)
Rooms in owner-occupied houses - 6 rooms (%)
Rooms in owner-occupied houses - 7 rooms (%)
Rooms in owner-occupied houses - 8 rooms (%)
Rooms in owner-occupied houses - 9+ rooms (%)
Rooms in renter-occupied houses - 1 room (%)
Rooms in renter-occupied houses - 2 rooms (%)
Rooms in renter-occupied houses - 3 rooms (%)
Rooms in renter-occupied houses - 4 rooms (%)
Rooms in renter-occupied houses - 5 rooms (%)
Rooms in renter-occupied houses - 6 rooms (%)
Rooms in renter-occupied houses - 7 rooms (%)
Rooms in renter-occupied houses - 8 rooms (%)
Rooms in renter-occupied houses - 9+ rooms (%)
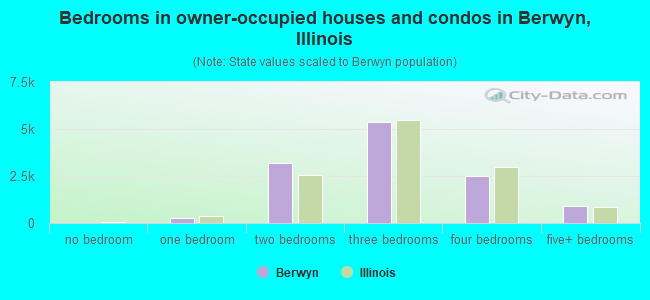
Bedrooms in owner-occupied houses - no bedrooms (%)
Bedrooms in owner-occupied houses - 1 bedroom (%)
Bedrooms in owner-occupied houses - 2 bedrooms (%)
Bedrooms in owner-occupied houses - 3 bedrooms (%)
Bedrooms in owner-occupied houses - 4 bedrooms (%)
Bedrooms in owner-occupied houses - 5+ bedrooms (%)
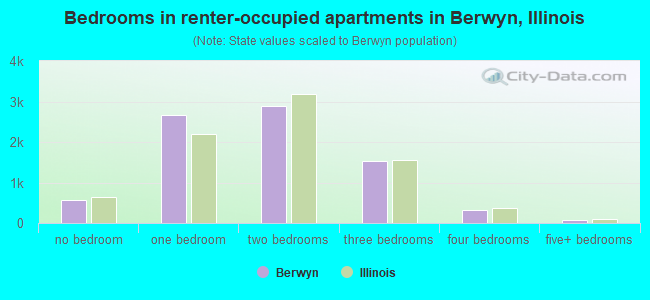
Bedrooms in renter-occupied houses - no bedrooms (%)
Bedrooms in renter-occupied houses - 1 bedroom (%)
Bedrooms in renter-occupied houses - 2 bedrooms (%)
Bedrooms in renter-occupied houses - 3 bedrooms (%)
Bedrooms in renter-occupied houses - 4 bedrooms (%)
Bedrooms in renter-occupied houses - 5+ bedrooms (%)
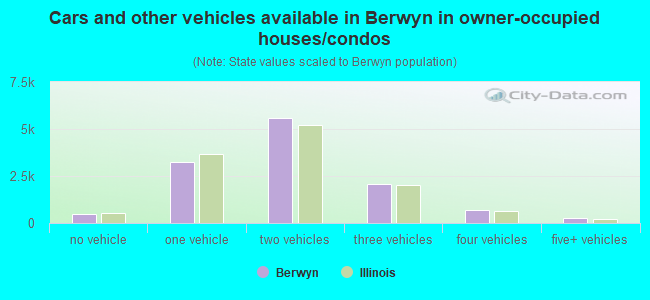
Vehicles available in owner-occupied houses - no vehicle available (%)
Vehicles available in owner-occupied houses - 1 vehicle available(%)
Vehicles available in owner-occupied houses - 2 Vehicles available (%)
Vehicles available in owner-occupied houses - 3 Vehicles available (%)
Vehicles available in owner-occupied houses - 4 Vehicles available (%)
Vehicles available in owner-occupied houses - 5+ Vehicles available (%)
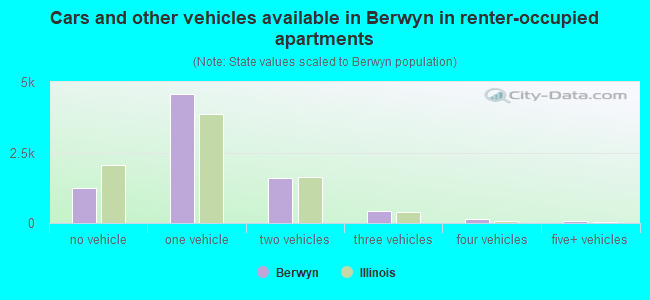
Vehicles available in renter-occupied houses - no vehicle available (%)
Vehicles available in renter-occupied houses - 1 vehicle available (%)
Vehicles available in renter-occupied houses - 2 Vehicles available (%)
Vehicles available in renter-occupied houses - 3 Vehicles available (%)
Vehicles available in renter-occupied houses - 4 Vehicles available (%)
Vehicles available in renter-occupied houses - 5+ Vehicles available (%)
Housing units in structures - 1, detached (%)
Housing units in structures - 1, attached (%)
Housing units in structures - 2 (%)
Housing units in structures - 3 or 4 (%)
Housing units in structures - 5 to 9 (%)
Housing units in structures - 10 to 19 (%)
Housing units in structures - 20 to 49 (%)
Housing units in structures - 50 or more (%)
Housing units in structures - Mobile home (%)
Housing units in structures - Boat, RV, van, etc. (%)
Housing units in structures - Owners - 1, detached (%)
Housing units in structures - Owners - 1, attached (%)
Housing units in structures - Owners - 2 (%)
Housing units in structures - Owners - 3 or 4 (%)
Housing units in structures - Owners - 5 to 9 (%)
Housing units in structures - Owners - 10 to 19 (%)
Housing units in structures - Owners - 20 to 49 (%)
Housing units in structures - Owners - 50 or more (%)
Housing units in structures - Owners - Mobile home (%)
Housing units in structures - Owners - Boat, RV, van, etc. (%)
Housing units in structures - Renters - 1, detached (%)
Housing units in structures - Renters - 1, attached (%)
Housing units in structures - Renters - 2 (%)
Housing units in structures - Renters - 3 or 4 (%)
Housing units in structures - Renters - 5 to 9 (%)
Housing units in structures - Renters - 10 to 19 (%)
Housing units in structures - Renters - 20 to 49 (%)
Housing units in structures - Renters - 50 or more (%)
Housing units in structures - Renters - Mobile home (%)
Housing units in structures - Renters - Boat, RV, van, etc. (%)
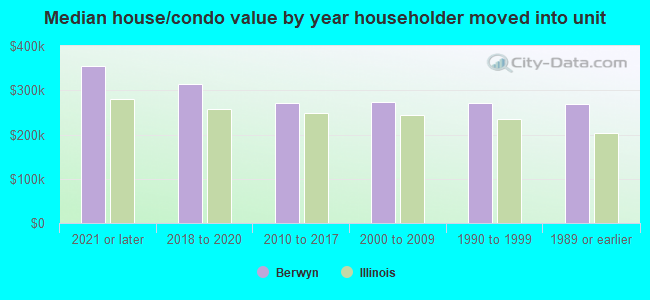
House/condo owner moved in on average (years ago)
Renter moved in on average (years ago)
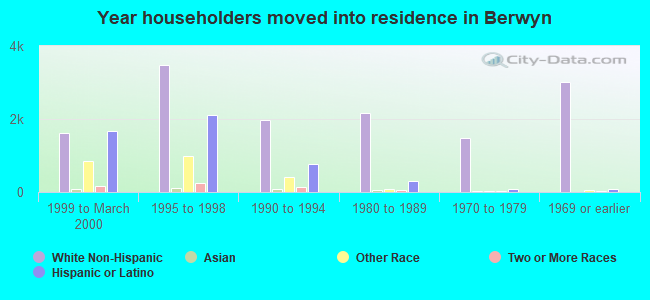
Year householder moved into unit - Moved in 1999 to March 2000 (%)
Year householder moved into unit - Moved in 1999 to March 2000 (%) - White
Year householder moved into unit - Moved in 1999 to March 2000 (%) - Black or African American
Year householder moved into unit - Moved in 1999 to March 2000 (%) - Asian
Year householder moved into unit - Moved in 1999 to March 2000 (%) - Hispanic or Latino
Year householder moved into unit - Moved in 1999 to March 2000 (%) - American Indian and Alaska Native
Year householder moved into unit - Moved in 1999 to March 2000 (%) - Multirace
Year householder moved into unit - Moved in 1999 to March 2000 (%) - Other Race
Year householder moved into unit - Moved in 1995 to 1998 (%)
Year householder moved into unit - Moved in 1995 to 1998 (%) - White
Year householder moved into unit - Moved in 1995 to 1998 (%) - Black or African American
Year householder moved into unit - Moved in 1995 to 1998 (%) - Asian
Year householder moved into unit - Moved in 1995 to 1998 (%) - Hispanic or Latino
Year householder moved into unit - Moved in 1995 to 1998 (%) - American Indian and Alaska Native
Year householder moved into unit - Moved in 1995 to 1998 (%) - Multirace
Year householder moved into unit - Moved in 1995 to 1998 (%) - Other Race
Year householder moved into unit - Moved in 1990 to 1994 (%)
Year householder moved into unit - Moved in 1990 to 1994 (%) - White
Year householder moved into unit - Moved in 1990 to 1994 (%) - Black or African American
Year householder moved into unit - Moved in 1990 to 1994 (%) - Asian
Year householder moved into unit - Moved in 1990 to 1994 (%) - Hispanic or Latino
Year householder moved into unit - Moved in 1990 to 1994 (%) - American Indian and Alaska Native
Year householder moved into unit - Moved in 1990 to 1994 (%) - Multirace
Year householder moved into unit - Moved in 1990 to 1994 (%) - Other Race
Year householder moved into unit - Moved in 1980 to 1989 (%)
Year householder moved into unit - Moved in 1980 to 1989 (%) - White
Year householder moved into unit - Moved in 1980 to 1989 (%) - Black or African American
Year householder moved into unit - Moved in 1980 to 1989 (%) - Asian
Year householder moved into unit - Moved in 1980 to 1989 (%) - Hispanic or Latino
Year householder moved into unit - Moved in 1980 to 1989 (%) - American Indian and Alaska Native
Year householder moved into unit - Moved in 1980 to 1989 (%) - Multirace
Year householder moved into unit - Moved in 1980 to 1989 (%) - Other Race
Year householder moved into unit - Moved in 1970 to 1979 (%)
Year householder moved into unit - Moved in 1970 to 1979 (%) - White
Year householder moved into unit - Moved in 1970 to 1979 (%) - Black or African American
Year householder moved into unit - Moved in 1970 to 1979 (%) - Asian
Year householder moved into unit - Moved in 1970 to 1979 (%) - Hispanic or Latino
Year householder moved into unit - Moved in 1970 to 1979 (%) - American Indian and Alaska Native
Year householder moved into unit - Moved in 1970 to 1979 (%) - Multirace
Year householder moved into unit - Moved in 1970 to 1979 (%) - Other Race
Year householder moved into unit - Moved in 1969 or earlier (%)
Year householder moved into unit - Moved in 1969 or earlier (%) - White
Year householder moved into unit - Moved in 1969 or earlier (%) - Black or African American
Year householder moved into unit - Moved in 1969 or earlier (%) - Asian
Year householder moved into unit - Moved in 1969 or earlier (%) - Hispanic or Latino
Year householder moved into unit - Moved in 1969 or earlier (%) - American Indian and Alaska Native
Year householder moved into unit - Moved in 1969 or earlier (%) - Multirace
Year householder moved into unit - Moved in 1969 or earlier (%) - Other Race
Housing units lacking complete plumbing facilities (%)
Housing units lacking complete kitchen facilities (%)
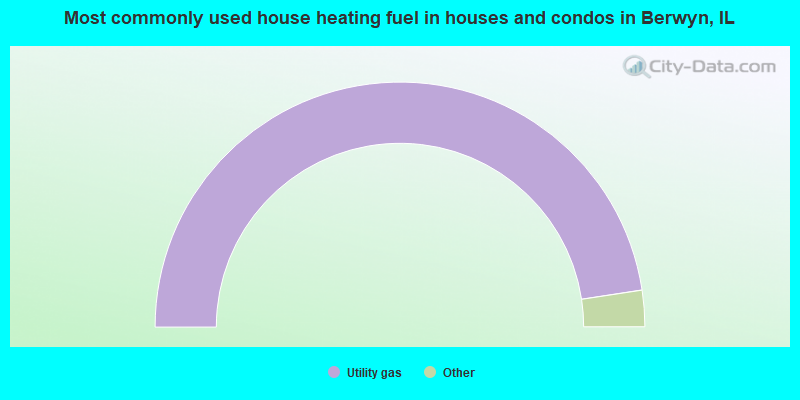
House heating fuel used in houses and condos - Utility gas (%)
House heating fuel used in houses and condos - Bottled, tank, or LP gas (%)
House heating fuel used in houses and condos - Electricity (%)
House heating fuel used in houses and condos - Fuel oil, kerosene, etc. (%)
House heating fuel used in houses and condos - Coal or coke (%)
House heating fuel used in houses and condos - Wood (%)
House heating fuel used in houses and condos - Solar energy (%)
House heating fuel used in houses and condos - Other fuel (%)
House heating fuel used in houses and condos - No fuel used (%)
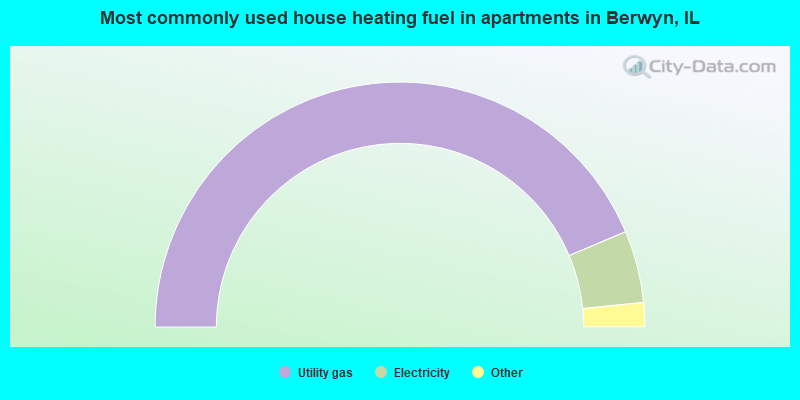
House heating fuel used in apartments - Utility gas (%)
House heating fuel used in apartments - Bottled, tank, or LP gas (%)
House heating fuel used in apartments - Electricity (%)
House heating fuel used in apartments - Fuel oil, kerosene, etc. (%)
House heating fuel used in apartments - Coal or coke (%)
House heating fuel used in apartments - Wood (%)
House heating fuel used in apartments - Solar energy (%)
House heating fuel used in apartments - Other fuel (%)
House heating fuel used in apartments - No fuel used (%)
Latest news about housing in Berwyn, IL collected exclusively by city-data.com from local newspapers, TV, and radio stations
Median year house/condo built: 1938Median year apartment built: 1940Household type by relationship:
Households: 55,299
Male householders: 10,080 (2,908 living alone ), Female householders: 9,380 (2,397 living alone )8,315 spouses (8,210 opposite-sex spouses ), 1,820 unmarried partners , (1,674 opposite-sex unmarried partners ), 18,164 children (17,467 natural , 189 adopted , 507 stepchildren ), 2,248 grandchildren , 999 brothers or sisters , 1,406 parents , 76 foster children , 1,369 other relatives , 1,256 non-relatives In group quarters: 180
Size of family households: 4,380 2-persons , 3,413 3-persons , 2,873 4-persons , 1,623 5-persons , 539 6-persons , 519 7-or-more-persons .
Size of nonfamily households: 5,700 1-person , 977 2-persons , 56 3-persons , 69 4-persons , 23 5-persons .
6,361 married couples with children. single-parent households (1,392 men , 3,296 women ).
45.1% of residents of Berwyn speak English at home. of residents speak Spanish at home (68% speak English very well , 18% speak English well , 12% speak English not well , 1% don't speak English at all ).of residents speak other Indo-European language at home (65% speak English very well , 22% speak English well , 11% speak English not well , 3% don't speak English at all ).of residents speak Asian or Pacific Island language at home (67% speak English very well , 16% speak English well , 16% speak English not well , 1% don't speak English at all ).of residents speak other language at home (90% speak English very well , 10% speak English well ).
Foreign born population: 14,130 (25.6%)of them are naturalized citizens )
Median number of rooms in houses and condos:
Median number of rooms in apartments
Owner-occupied Renter-occupied
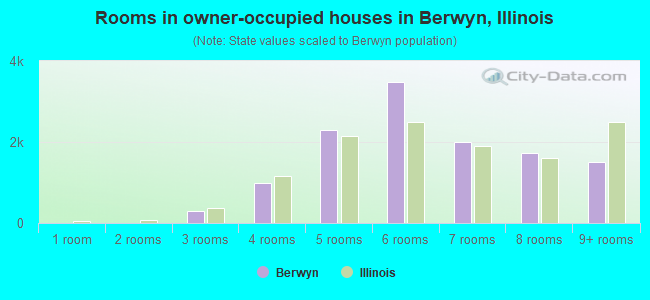
Rooms in owner-occupied houses in Berwyn, Illinois
4 1 room 0 2 rooms 304 3 rooms 976 4 rooms 2,284 5 rooms 3,486 6 rooms 1,996 7 rooms 1,726 8 rooms 1,512 9+ rooms
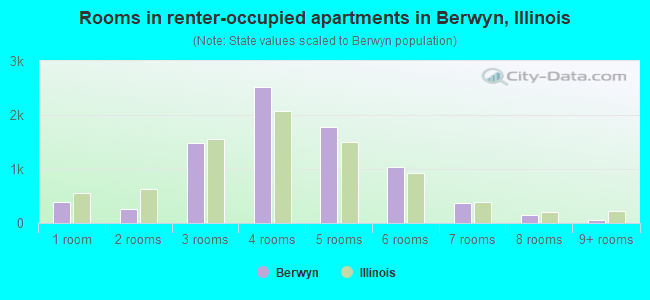
Rooms in renter-occupied apartments in Berwyn, Illinois
397 1 room 255 2 rooms 1,476 3 rooms 2,516 4 rooms 1,769 5 rooms 1,040 6 rooms 375 7 rooms 152 8 rooms 61 9+ rooms
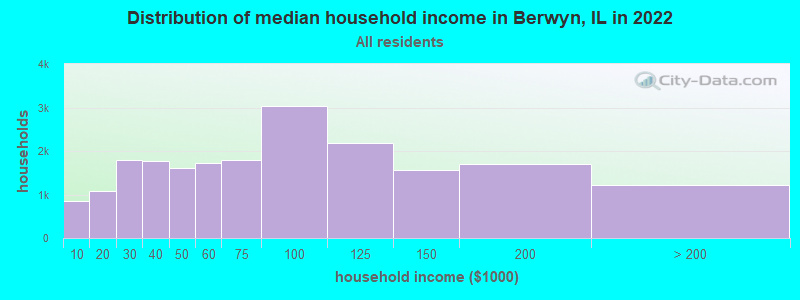
Berwyn, IL household income distribution 847 Less than $10,0001,081 $10,000 to $19,9991,790 $20,000 to $29,9991,772 $30,000 to $39,9991,603 $40,000 to $49,9991,732 $50,000 to $59,9991,801 $60,000 to $74,9993,035 $75,000 to $99,9992,176 $100,000 to $124,9991,569 $125,000 to $149,9991,708 $150,000 to $199,9991,214 $200,000 or more
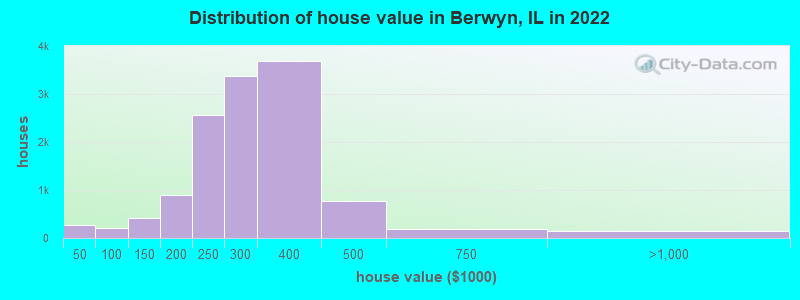
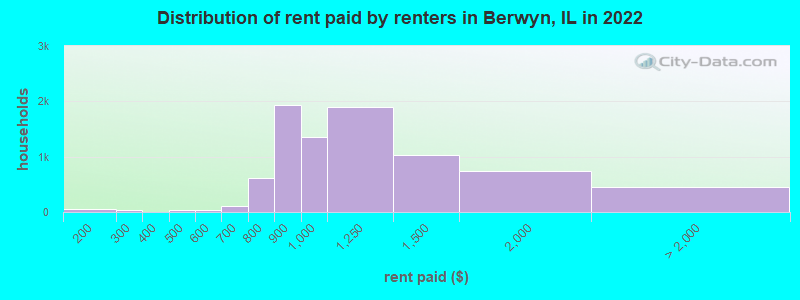
Home value of owner - occupied houses in 2022 in Berwyn, IL 92 Less than $10,00015 $10,000 to $14,99911 $20,000 to $24,99996 $25,000 to $29,99917 $30,000 to $34,99910 $35,000 to $39,99918 $40,000 to $49,99916 $50,000 to $59,99985 $80,000 to $89,99980 $90,000 to $99,999154 $100,000 to $124,999271 $125,000 to $149,999311 $150,000 to $174,999577 $175,000 to $199,9992,559 $200,000 to $249,9993,371 $250,000 to $299,9993,686 $300,000 to $399,999767 $400,000 to $499,999178 $500,000 to $749,99975 $750,000 to $999,99932 $1,000,000 to $1,499,9999 $1,500,000 to $1,999,99921 $2,000,000 or moreRent paid by renters in 2022 in Berwyn, IL 51 $150 to $19943 $200 to $24919 $400 to $44910 $450 to $49935 $500 to $5499 $550 to $59985 $600 to $64931 $650 to $699175 $700 to $749437 $750 to $7991,936 $800 to $8991,351 $900 to $9991,894 $1,000 to $1,2491,036 $1,250 to $1,499743 $1,500 to $1,99926 $2,500 to $2,99915 $3,000 to $3,499417 No cash rent
Percentage of workers working in this county: 84.6%Number of people working at home: 3,011 (10.5% of all workers )
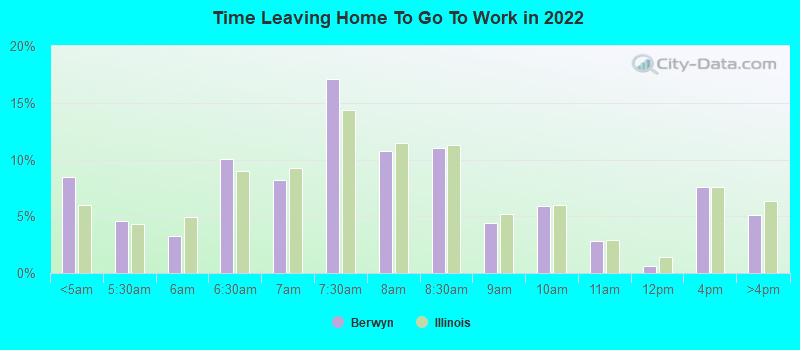
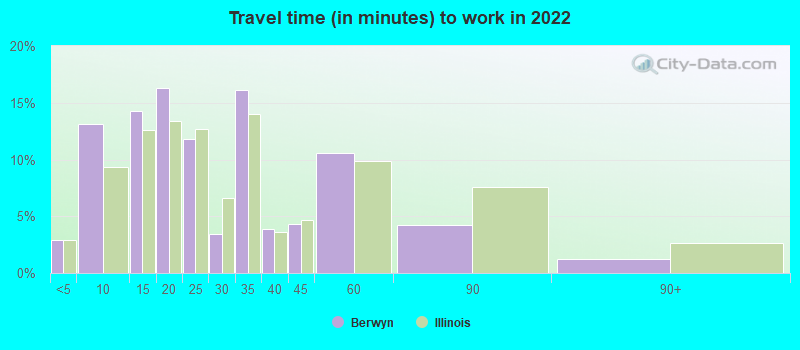
Travel time to work (commute)
Less than 5 minutes: 3105 to 9 minutes: 1,71510 to 14 minutes: 3,27015 to 19 minutes: 2,50920 to 24 minutes: 3,09025 to 29 minutes: 1,30430 to 34 minutes: 4,70935 to 39 minutes: 1,36540 to 44 minutes: 1,36045 to 59 minutes: 2,97760 to 89 minutes: 1,83590 or more minutes: 505
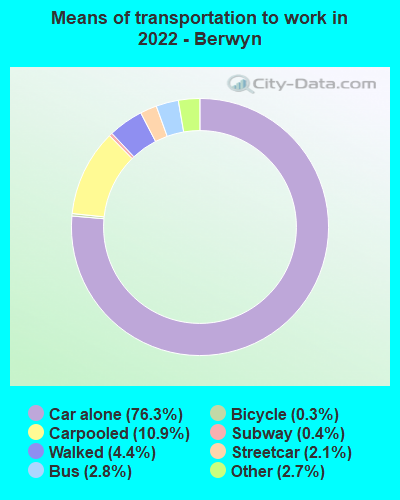
Means of transportation to work:
Drove a car alone: 8,583 (62.1%)Carpooled: 1,317 (9.5%)Bus : 291 (2.1%)Subway or elevated rail : 183 (1.3%)Long-distance train or commuter rail : 32 (0.2%)Taxi: 305 (2.2%)Bicycle: 33 (0.2%)Walked: 512 (3.7%)Worked at home: 3,011 (21.8%)
Unemployment by race in 2022
Unemployment rate for White non-Hispanic residents 1.2% Males4.2% FemalesUnemployment rate for Black residents 9.2% Males5.9% FemalesUnemployment rate for American Indian and Alaska Native residents 14.9% FemalesUnemployment rate for Asian residents 23.7% Males5.2% FemalesUnemployment rate for other race residents 3.5% Males3.0% FemalesUnemployment rate for two or more race residents 5.4% Males3.2% FemalesUnemployment rate for Hispanic or Latino residents 3.9% Males3.4% Females
Year of entry for the foreign-born population in Berwyn, Illinois
1,794 2010 or later 2,902 2000 to 2009 3,741 1990 to 1999 3,315 1980 to 1989 2,731 1970 to 1979 2,325 Before 1970
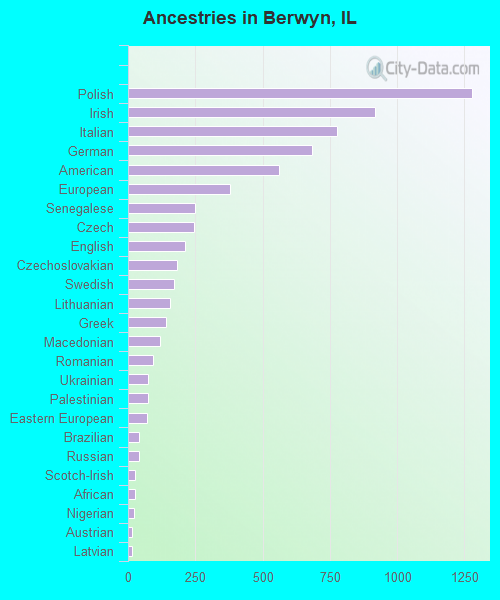
First ancestries reported:
Polish: 1,278 (3.6%)
Irish: 920 (2.6%)
Italian: 778 (2.2%)
German: 685 (1.9%)
American: 561 (1.6%)
European: 378 (1.1%)
Senegalese: 248 (0.7%)
Czech: 246 (0.7%)
English: 212 (0.6%)
Czechoslovakian: 183 (0.5%)
Swedish: 172 (0.5%)
Lithuanian: 157 (0.4%)
Greek: 143 (0.4%)
Macedonian: 120 (0.3%)
Romanian: 92 (0.3%)
Ukrainian: 74 (0.2%)
Palestinian: 73 (0.2%)
Eastern European: 72 (0.2%)
Brazilian: 41 (0.1%)
Russian: 41 (0.1%)
Scotch-Irish: 26 (0.07%)
African: 25 (0.07%)
Nigerian: 21 (0.06%)
Austrian: 14 (0.04%)
Latvian: 14 (0.04%)
Haitian: 12 (0.03%)
Dutch: 12 (0.03%)
British: 10 (0.03%)
Moroccan: 10 (0.03%)
Slavic: 9 (0.03%)
Ghanaian: 9 (0.03%)
French: 8 (0.02%)
Cajun: 7 (0.02%)
Armenian: 7 (0.02%)
Bahamian: 5 (0.01%)
Hungarian: 4 (0.01%)
Arab: 3 (0.01%)
Croatian: 2 (0.01%) Most common places of birth for foreign-born residents (%): Mexico Berwyn:
72.0% (10,180)Illinois:
34.7% (626,958)
Philippines Berwyn:
6.6% (928)Illinois:
5.2% (93,003)
Guatemala Berwyn:
1.9% (264)Illinois:
1.3% (22,793)
Colombia Berwyn:
1.7% (236)Illinois:
0.9% (16,553)
Poland Berwyn:
1.6% (232)Illinois:
6.9% (124,474)
Place of birth for U.S.-born residents:
This state: 34,875Other state: 4,751Northeast: 793Midwest: 2,064South: 1,128West: 777 91.7% of Berwyn residents lived in the same house 1 years ago.
Out of people who lived in different houses, 47.4% lived in this county.
Out of people who lived in different counties, 42.4% lived in Illinois.
Berwyn:
91.7%State average:
88.3%
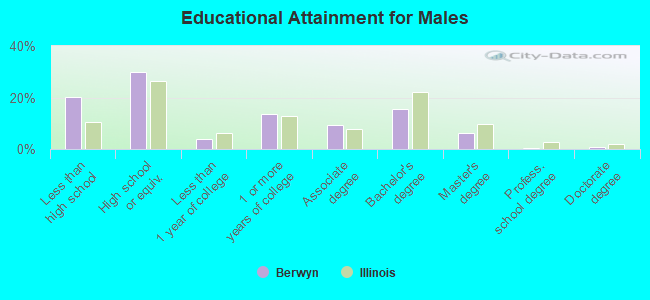
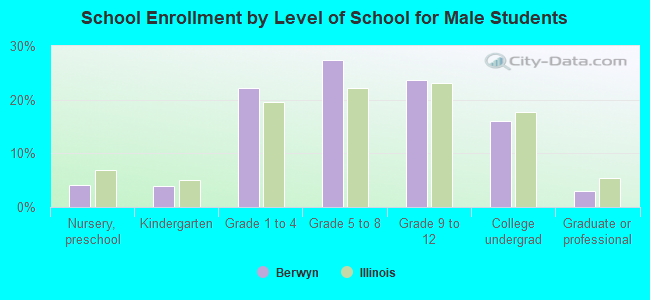
Education attainment for males 25 years and older:
No schooling: 770Nursery to 4th grade: 1475th and 6th grade: 7267th and 8th grade: 2479th grade: 27010th grade: 26011th grade: 41712th grade, no diploma: 857High school graduate (or equivalency): 5,475Less than 1 year of college: 735Some college more than 1 year, no degree: 2,501Associate degree: 1,726Bachelor's degree: 2,823Master's degree: 1,119Professional school degree: 89Doctorate degree: 129
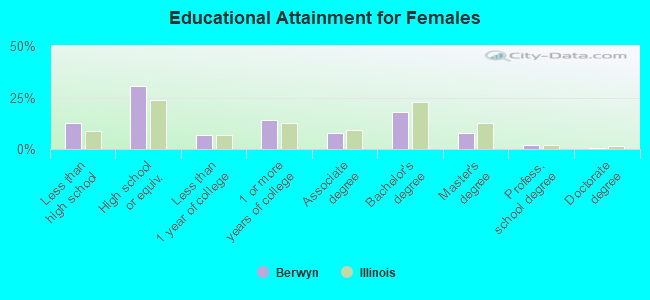
Education attainment for females 25 years and older:
No schooling: 329Nursery to 4th grade: 995th and 6th grade: 6997th and 8th grade: 3119th grade: 21610th grade: 13311th grade: 8712th grade, no diploma: 395High school graduate (or equivalency): 5,609Less than 1 year of college: 1,250Some college more than 1 year, no degree: 2,532Associate degree: 1,452Bachelor's degree: 3,238Master's degree: 1,409Professional school degree: 358Doctorate degree: 109
Housing units in structures:
One, detached: 11,119One, attached: 165Two: 3,5653 or 4: 2,8455 to 9: 2,25610 to 19: 86120 to 49: 56650 or more: 265Mobile homes: 98Median worth of mobile homes: $242,464
Housing units lacking complete plumbing facilities in 2022: 1.4%Housing units lacking complete kitchen facilities in 2022: 1.7%House/condo owner moved in on average 13 years ago
Renter moved in on average 5 years ago
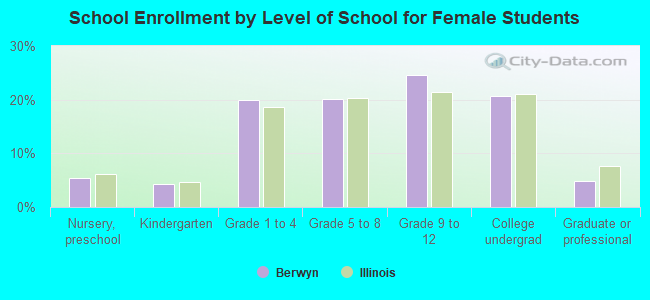
Private vs. public school enrollment:
Students in private schools in grades 1 to 8 (elementary and middle school): 945 Students in private schools in grades 9 to 12 (high school): 280 Students in private undergraduate colleges: 842