Bismarck, ND (North Dakota) Houses and Residents
Estimated median house or condo value in 2022: $312,300 (it was $90,300 in 2000 )
Bismarck:
$312,300North Dakota:
$243,100
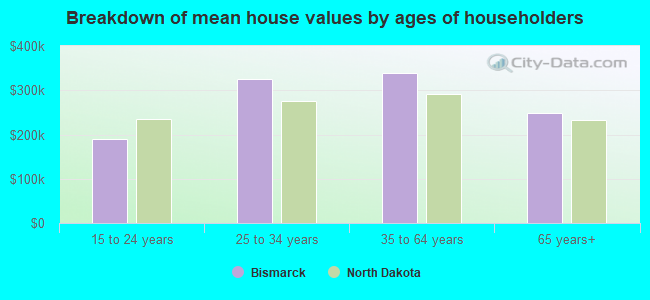
Lower value quartile - upper value quartile: $229,700 - $397,100Mean price in 2022: Detached houses: $335,945 Here:
$335,945State:
$284,144
Townhouses or other attached units: $314,975 Here:
$314,975State:
$250,572
In 3-to-4-unit structures: $204,194 Here:
$204,194State:
$229,360
In 5-or-more-unit structures: $198,161 Here:
$198,161State:
$231,934
Mobile homes: $58,582 Here:
$58,582State:
$85,388
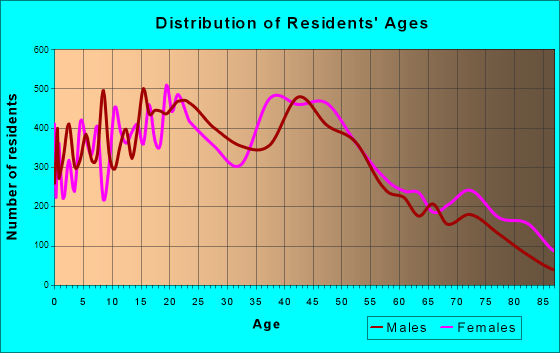
Total population: 68,896 (Urban population: 55,269, Rural population: 15 (all nonfarm) )
Houses: 35,034 (33,320 occupied: 21,957 owner occupied, 11,363 renter occupied )
% of renters here:
34%State:
35%
Housing density: 1,303 houses/condos per square mile
Median price asked for vacant for-sale houses and condos in 2022: $165,960.
Median contract rent in 2022: $822 (lower quartile is $639, upper quartile is $1,047)
Median rent asked for vacant for-rent units in 2022: $799
Median gross rent in Bismarck, ND in 2022: $877
Housing units in Bismarck with a mortgage: 13,120 (1,580 second mortgage, 0 home equity loan, 826 both second mortgage and home equity loan )Houses without a mortgage: 371
Median household income for houses/condos with a mortgage: $104,841
Median household income for apartments without a mortgage: $86,347
Median monthly housing costs: $1,010
Data:
Median house or condo value ($)
Median house or condo value ($ change since 2000)
Median house or condo value ($) - White
Median house or condo value ($) - Black or African American
Median house or condo value ($) - Asian
Median house or condo value ($) - Hispanic or Latino
Median house or condo value ($) - American Indian and Alaska Native
Median house or condo value ($) - Multirace
Median house or condo value ($) - Other Race
Median price asked for mobile homes ($)
Household density (households per square mile)
Mean house or condo value by units in structure - 1, detached ($)
Mean house or condo value by units in structure - 1, attached ($)
Mean house or condo value by units in structure - 2 ($)
Mean house or condo value by units in structure by units in structure - 3 or 4 ($)
Mean house or condo value by units in structure - 5 or more ($)
Mean house or condo value by units in structure - Boat, RV, van, etc. ($)
Mean house or condo value by units in structure - Mobile home ($)
Median contract rent ($)
Median contract rent - Lower quartile ($)
Median contract rent - Upper quartile ($)
Median gross rent ($)
Urban houses (%)
Rural houses (%)
Houses occupied (%)
Houses occupied (% change since 2000)
Houses owner occupied (%)
Houses owner occupied (% change since 2000)
Houses renter occupied (%)
Houses renter occupied (% change since 2000)
Vacant housing units - For rent (%)
Vacant housing units - For rent (% change since 2000)
Vacant housing units - For sale only (%)
Vacant housing units - For sale only (% change since 2000)
Vacant housing units - Rented or sold, not occupied (%)
Vacant housing units - Rented or sold, not occupied (% change since 2000)
Vacant housing units - For seasonal, recreational, or occasional use (%)
Vacant housing units - For seasonal, recreational, or occasional use (% change since 2000)
Vacant housing units - For migrant workers (%)
Vacant housing units - For migrant workers (% change since 2000)
Vacant housing units - Other vacant (%)
Vacant housing units - Other vacant (% change since 2000)
Median monthly housing costs ($)
Median household income for houses/condos with a mortgage ($)
Median household income for houses/condos without a mortgage ($)
Median household income ($)
Median household income ($) - White
Median household income ($) - Black or African American
Median household income ($) - Asian
Median household income ($) - Hispanic or Latino
Median household income ($) - American Indian and Alaska Native
Median household income ($) - Multirace
Median household income ($) - Other Race
Mortgage status - with mortgage (%)
Mortgage status - with second mortgage (%)
Mortgage status - with home equity loan (%)
Mortgage status - with both second mortgage and home equity loan (%)
Mortgage status - without a mortgage (%)
Median year house/condo built
Median year apartment built
Household type by relationship - Male householder living alone (%)
Household type by relationship - Male householder not living alone (%)
Household type by relationship - Female householder living alone (%)
Household type by relationship - Female householder not living alone (%)
Household type by relationship - Opposite-Sex spouse (%)
Household type by relationship - Same-Sex spouse (%)
Household type by relationship - Opposite-Sex unmarried partner (%)
Household type by relationship - Same-Sex unmarried partner (%)
Household type by relationship - In group quarters (%)
Size of family households - 2-person household (%)
Size of family households - 3-person household (%)
Size of family households - 4-person household (%)
Size of family households - 5-person household (%)
Size of family households - 6-person household (%)
Size of family households - 7-or-more-person household (%)
Size of nonfamily households - 1-person household (%)
Size of nonfamily households - 2-person household (%)
Size of nonfamily households - 3-person household (%)
Size of nonfamily households - 4-person household (%)
Size of nonfamily households - 5-person household (%)
Size of nonfamily households - 6-person household (%)
Size of nonfamily households - 7-or-moreperson household (%)
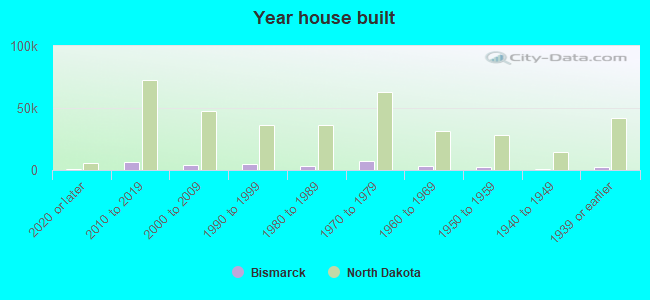
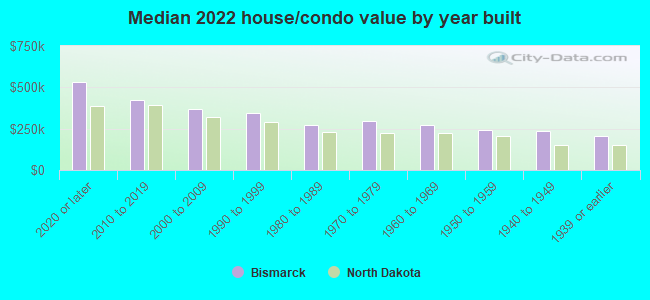
Year house built - Built 2010 or later (%)
Year house built - Built 2000 to 2009 (%)
Year house built - Built 1990 to 1999 (%)
Year house built - Built 1980 to 1989 (%)
Year house built - Built 1970 to 1979 (%)
Year house built - Built 1960 to 1969 (%)
Year house built - Built 1950 to 1959 (%)
Year house built - Built 1940 to 1949 (%)
Year house built - Built 1939 or earlier (%)
Median number of rooms in houses and condos
Median number of rooms in apartments
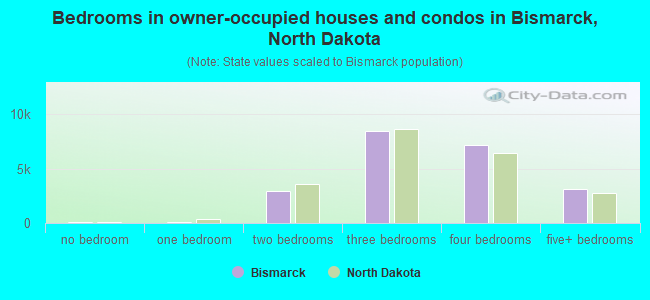
Median number of bedrooms in owner occupied houses
Mean number of bedrooms in owner occupied houses
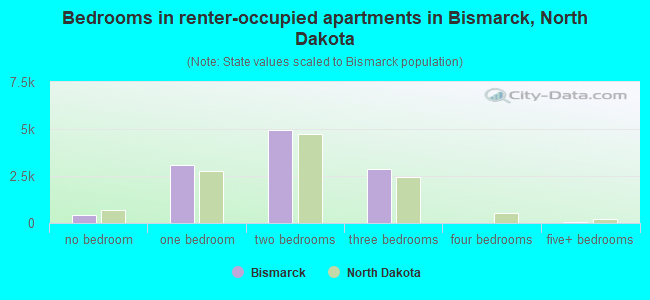
Median number of bedrooms in renter occupied houses
Mean number of bedrooms in renter occupied houses
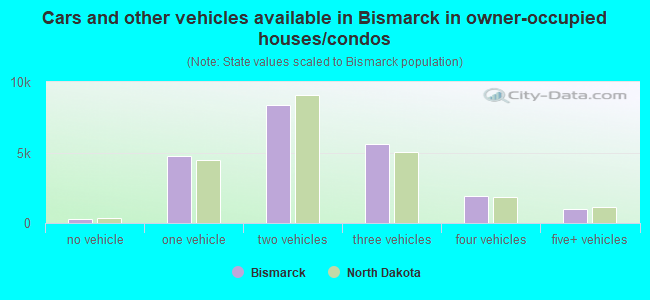
Median number of vehichles in owner occupied houses
Mean number of vehichles in owner occupied houses
Median number of vehichles in renter occupied houses
Mean number of vehichles in renter occupied houses
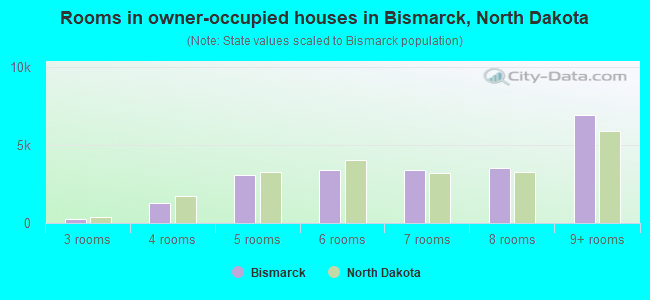
Rooms in owner-occupied houses - 1 room (%)
Rooms in owner-occupied houses - 2 rooms (%)
Rooms in owner-occupied houses - 3 rooms (%)
Rooms in owner-occupied houses - 4 rooms (%)
Rooms in owner-occupied houses - 5 rooms (%)
Rooms in owner-occupied houses - 6 rooms (%)
Rooms in owner-occupied houses - 7 rooms (%)
Rooms in owner-occupied houses - 8 rooms (%)
Rooms in owner-occupied houses - 9+ rooms (%)
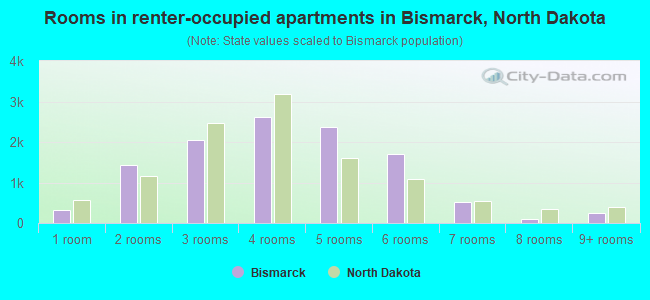
Rooms in renter-occupied houses - 1 room (%)
Rooms in renter-occupied houses - 2 rooms (%)
Rooms in renter-occupied houses - 3 rooms (%)
Rooms in renter-occupied houses - 4 rooms (%)
Rooms in renter-occupied houses - 5 rooms (%)
Rooms in renter-occupied houses - 6 rooms (%)
Rooms in renter-occupied houses - 7 rooms (%)
Rooms in renter-occupied houses - 8 rooms (%)
Rooms in renter-occupied houses - 9+ rooms (%)
Bedrooms in owner-occupied houses - no bedrooms (%)
Bedrooms in owner-occupied houses - 1 bedroom (%)
Bedrooms in owner-occupied houses - 2 bedrooms (%)
Bedrooms in owner-occupied houses - 3 bedrooms (%)
Bedrooms in owner-occupied houses - 4 bedrooms (%)
Bedrooms in owner-occupied houses - 5+ bedrooms (%)
Bedrooms in renter-occupied houses - no bedrooms (%)
Bedrooms in renter-occupied houses - 1 bedroom (%)
Bedrooms in renter-occupied houses - 2 bedrooms (%)
Bedrooms in renter-occupied houses - 3 bedrooms (%)
Bedrooms in renter-occupied houses - 4 bedrooms (%)
Bedrooms in renter-occupied houses - 5+ bedrooms (%)
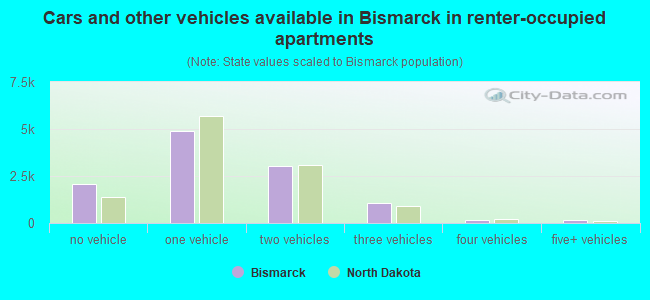
Vehicles available in owner-occupied houses - no vehicle available (%)
Vehicles available in owner-occupied houses - 1 vehicle available(%)
Vehicles available in owner-occupied houses - 2 Vehicles available (%)
Vehicles available in owner-occupied houses - 3 Vehicles available (%)
Vehicles available in owner-occupied houses - 4 Vehicles available (%)
Vehicles available in owner-occupied houses - 5+ Vehicles available (%)
Vehicles available in renter-occupied houses - no vehicle available (%)
Vehicles available in renter-occupied houses - 1 vehicle available (%)
Vehicles available in renter-occupied houses - 2 Vehicles available (%)
Vehicles available in renter-occupied houses - 3 Vehicles available (%)
Vehicles available in renter-occupied houses - 4 Vehicles available (%)
Vehicles available in renter-occupied houses - 5+ Vehicles available (%)
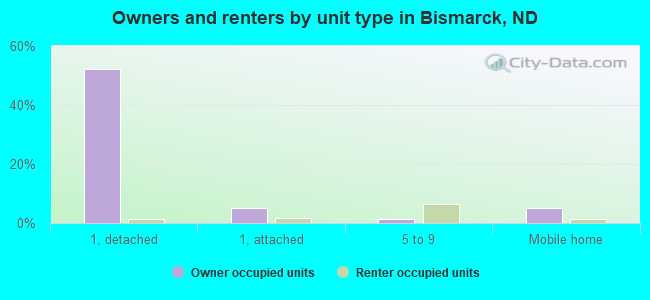
Housing units in structures - 1, detached (%)
Housing units in structures - 1, attached (%)
Housing units in structures - 2 (%)
Housing units in structures - 3 or 4 (%)
Housing units in structures - 5 to 9 (%)
Housing units in structures - 10 to 19 (%)
Housing units in structures - 20 to 49 (%)
Housing units in structures - 50 or more (%)
Housing units in structures - Mobile home (%)
Housing units in structures - Boat, RV, van, etc. (%)
Housing units in structures - Owners - 1, detached (%)
Housing units in structures - Owners - 1, attached (%)
Housing units in structures - Owners - 2 (%)
Housing units in structures - Owners - 3 or 4 (%)
Housing units in structures - Owners - 5 to 9 (%)
Housing units in structures - Owners - 10 to 19 (%)
Housing units in structures - Owners - 20 to 49 (%)
Housing units in structures - Owners - 50 or more (%)
Housing units in structures - Owners - Mobile home (%)
Housing units in structures - Owners - Boat, RV, van, etc. (%)
Housing units in structures - Renters - 1, detached (%)
Housing units in structures - Renters - 1, attached (%)
Housing units in structures - Renters - 2 (%)
Housing units in structures - Renters - 3 or 4 (%)
Housing units in structures - Renters - 5 to 9 (%)
Housing units in structures - Renters - 10 to 19 (%)
Housing units in structures - Renters - 20 to 49 (%)
Housing units in structures - Renters - 50 or more (%)
Housing units in structures - Renters - Mobile home (%)
Housing units in structures - Renters - Boat, RV, van, etc. (%)
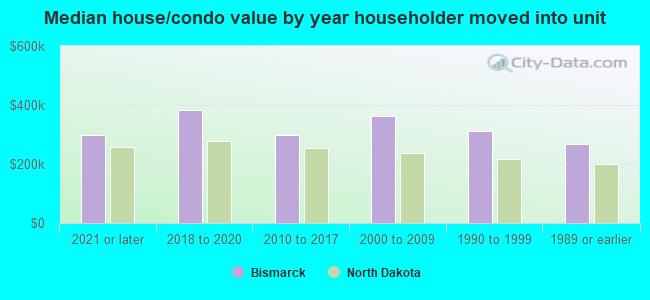
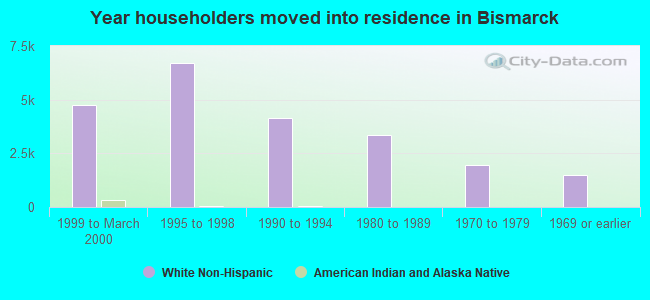
House/condo owner moved in on average (years ago)
Renter moved in on average (years ago)
Year householder moved into unit - Moved in 1999 to March 2000 (%)
Year householder moved into unit - Moved in 1999 to March 2000 (%) - White
Year householder moved into unit - Moved in 1999 to March 2000 (%) - Black or African American
Year householder moved into unit - Moved in 1999 to March 2000 (%) - Asian
Year householder moved into unit - Moved in 1999 to March 2000 (%) - Hispanic or Latino
Year householder moved into unit - Moved in 1999 to March 2000 (%) - American Indian and Alaska Native
Year householder moved into unit - Moved in 1999 to March 2000 (%) - Multirace
Year householder moved into unit - Moved in 1999 to March 2000 (%) - Other Race
Year householder moved into unit - Moved in 1995 to 1998 (%)
Year householder moved into unit - Moved in 1995 to 1998 (%) - White
Year householder moved into unit - Moved in 1995 to 1998 (%) - Black or African American
Year householder moved into unit - Moved in 1995 to 1998 (%) - Asian
Year householder moved into unit - Moved in 1995 to 1998 (%) - Hispanic or Latino
Year householder moved into unit - Moved in 1995 to 1998 (%) - American Indian and Alaska Native
Year householder moved into unit - Moved in 1995 to 1998 (%) - Multirace
Year householder moved into unit - Moved in 1995 to 1998 (%) - Other Race
Year householder moved into unit - Moved in 1990 to 1994 (%)
Year householder moved into unit - Moved in 1990 to 1994 (%) - White
Year householder moved into unit - Moved in 1990 to 1994 (%) - Black or African American
Year householder moved into unit - Moved in 1990 to 1994 (%) - Asian
Year householder moved into unit - Moved in 1990 to 1994 (%) - Hispanic or Latino
Year householder moved into unit - Moved in 1990 to 1994 (%) - American Indian and Alaska Native
Year householder moved into unit - Moved in 1990 to 1994 (%) - Multirace
Year householder moved into unit - Moved in 1990 to 1994 (%) - Other Race
Year householder moved into unit - Moved in 1980 to 1989 (%)
Year householder moved into unit - Moved in 1980 to 1989 (%) - White
Year householder moved into unit - Moved in 1980 to 1989 (%) - Black or African American
Year householder moved into unit - Moved in 1980 to 1989 (%) - Asian
Year householder moved into unit - Moved in 1980 to 1989 (%) - Hispanic or Latino
Year householder moved into unit - Moved in 1980 to 1989 (%) - American Indian and Alaska Native
Year householder moved into unit - Moved in 1980 to 1989 (%) - Multirace
Year householder moved into unit - Moved in 1980 to 1989 (%) - Other Race
Year householder moved into unit - Moved in 1970 to 1979 (%)
Year householder moved into unit - Moved in 1970 to 1979 (%) - White
Year householder moved into unit - Moved in 1970 to 1979 (%) - Black or African American
Year householder moved into unit - Moved in 1970 to 1979 (%) - Asian
Year householder moved into unit - Moved in 1970 to 1979 (%) - Hispanic or Latino
Year householder moved into unit - Moved in 1970 to 1979 (%) - American Indian and Alaska Native
Year householder moved into unit - Moved in 1970 to 1979 (%) - Multirace
Year householder moved into unit - Moved in 1970 to 1979 (%) - Other Race
Year householder moved into unit - Moved in 1969 or earlier (%)
Year householder moved into unit - Moved in 1969 or earlier (%) - White
Year householder moved into unit - Moved in 1969 or earlier (%) - Black or African American
Year householder moved into unit - Moved in 1969 or earlier (%) - Asian
Year householder moved into unit - Moved in 1969 or earlier (%) - Hispanic or Latino
Year householder moved into unit - Moved in 1969 or earlier (%) - American Indian and Alaska Native
Year householder moved into unit - Moved in 1969 or earlier (%) - Multirace
Year householder moved into unit - Moved in 1969 or earlier (%) - Other Race
Housing units lacking complete plumbing facilities (%)
Housing units lacking complete kitchen facilities (%)
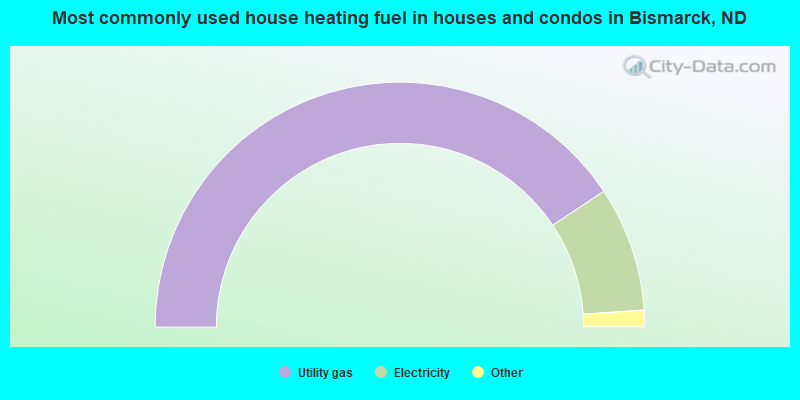
House heating fuel used in houses and condos - Utility gas (%)
House heating fuel used in houses and condos - Bottled, tank, or LP gas (%)
House heating fuel used in houses and condos - Electricity (%)
House heating fuel used in houses and condos - Fuel oil, kerosene, etc. (%)
House heating fuel used in houses and condos - Coal or coke (%)
House heating fuel used in houses and condos - Wood (%)
House heating fuel used in houses and condos - Solar energy (%)
House heating fuel used in houses and condos - Other fuel (%)
House heating fuel used in houses and condos - No fuel used (%)
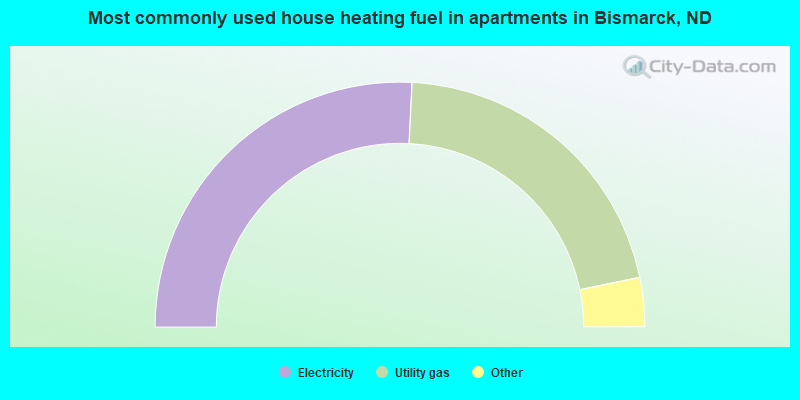
House heating fuel used in apartments - Utility gas (%)
House heating fuel used in apartments - Bottled, tank, or LP gas (%)
House heating fuel used in apartments - Electricity (%)
House heating fuel used in apartments - Fuel oil, kerosene, etc. (%)
House heating fuel used in apartments - Coal or coke (%)
House heating fuel used in apartments - Wood (%)
House heating fuel used in apartments - Solar energy (%)
House heating fuel used in apartments - Other fuel (%)
House heating fuel used in apartments - No fuel used (%)
Latest news about housing in Bismarck, ND collected exclusively by city-data.com from local newspapers, TV, and radio stations
Median year house/condo built: 1984Median year apartment built: 1986Household type by relationship:
Households: 74,444
Male householders: 15,678 (5,606 living alone ), Female householders: 17,642 (6,065 living alone )15,163 spouses (15,163 opposite-sex spouses ), 1,744 unmarried partners , (1,744 opposite-sex unmarried partners ), 17,223 children (16,637 natural , 326 adopted , 260 stepchildren ), 963 grandchildren , 771 brothers or sisters , 351 parents , 80 foster children , 360 other relatives , 1,913 non-relatives In group quarters: 2,556
Size of family households: 8,485 2-persons , 4,220 3-persons , 3,601 4-persons , 1,558 5-persons , 669 6-persons , 105 7-or-more-persons .
Size of nonfamily households: 11,671 1-person , 2,742 2-persons , 199 3-persons , 70 4-persons .
11,118 married couples with children. single-parent households (788 men , 3,063 women ).
94.3% of residents of Bismarck speak English at home. of residents speak Spanish at home (59% speak English very well , 31% speak English well , 7% speak English not well , 4% don't speak English at all ).of residents speak other Indo-European language at home (81% speak English very well , 13% speak English well , 6% speak English not well ).of residents speak Asian or Pacific Island language at home (49% speak English very well , 44% speak English well , 6% speak English not well ).of residents speak other language at home (40% speak English very well , 60% speak English well ).
Foreign born population: 4,471 (6.0%)of them are naturalized citizens )
Median number of rooms in houses and condos:
Median number of rooms in apartments
Owner-occupied Renter-occupied
Rooms in owner-occupied houses in Bismarck, North Dakota
55 1 room 0 2 rooms 269 3 rooms 1,261 4 rooms 3,101 5 rooms 3,409 6 rooms 3,386 7 rooms 3,531 8 rooms 6,945 9+ rooms
Rooms in renter-occupied apartments in Bismarck, North Dakota
311 1 room 1,444 2 rooms 2,051 3 rooms 2,621 4 rooms 2,362 5 rooms 1,713 6 rooms 518 7 rooms 96 8 rooms 247 9+ rooms
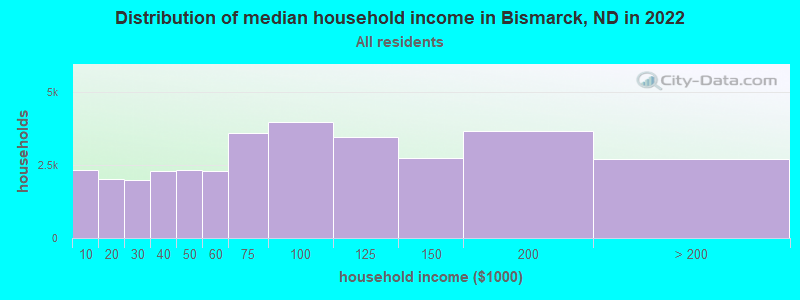
Bismarck, ND household income distribution 2,312 Less than $10,0002,002 $10,000 to $19,9991,968 $20,000 to $29,9992,301 $30,000 to $39,9992,331 $40,000 to $49,9992,293 $50,000 to $59,9993,594 $60,000 to $74,9993,967 $75,000 to $99,9993,471 $100,000 to $124,9992,730 $125,000 to $149,9993,655 $150,000 to $199,9992,696 $200,000 or more
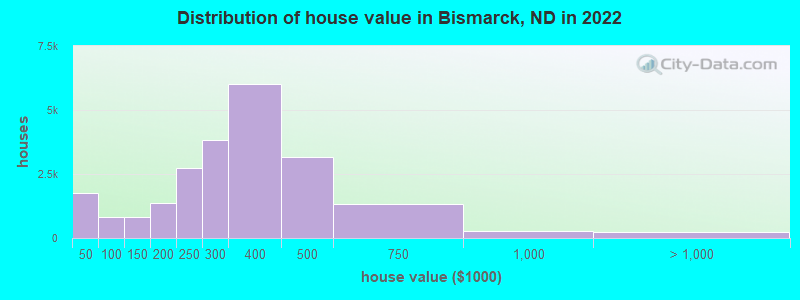
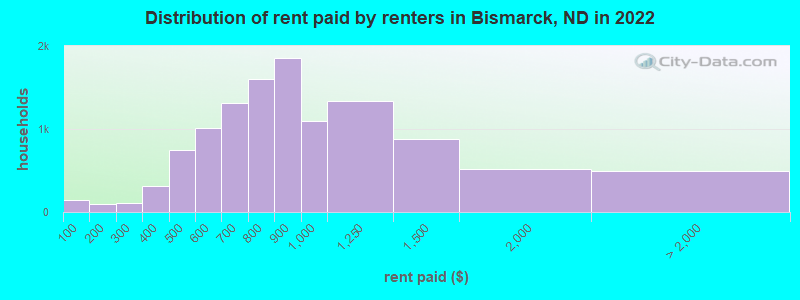
Home value of owner - occupied houses in 2022 in Bismarck, ND 261 Less than $10,000371 $10,000 to $14,999233 $15,000 to $19,999353 $20,000 to $24,999231 $25,000 to $29,999135 $30,000 to $34,99929 $35,000 to $39,999127 $40,000 to $49,999107 $50,000 to $59,99982 $60,000 to $69,999155 $70,000 to $79,99994 $80,000 to $89,999237 $90,000 to $99,999315 $100,000 to $124,999520 $125,000 to $149,999754 $150,000 to $174,999603 $175,000 to $199,9992,720 $200,000 to $249,9993,842 $250,000 to $299,9996,008 $300,000 to $399,9993,180 $400,000 to $499,9991,334 $500,000 to $749,999255 $750,000 to $999,999164 $1,000,000 to $1,499,99918 $1,500,000 to $1,999,99960 $2,000,000 or moreRent paid by renters in 2022 in Bismarck, ND 140 Less than $100100 $150 to $19950 $200 to $24960 $250 to $29960 $300 to $349256 $350 to $399373 $400 to $449370 $450 to $499364 $500 to $549649 $550 to $599592 $600 to $649722 $650 to $699684 $700 to $749917 $750 to $7991,853 $800 to $8991,091 $900 to $9991,341 $1,000 to $1,249881 $1,250 to $1,499517 $1,500 to $1,9999 $2,000 to $2,499191 $3,500 or more298 No cash rent
Percentage of workers working in this county: 88.8%Number of people working at home: 2,636 (6.9% of all workers )
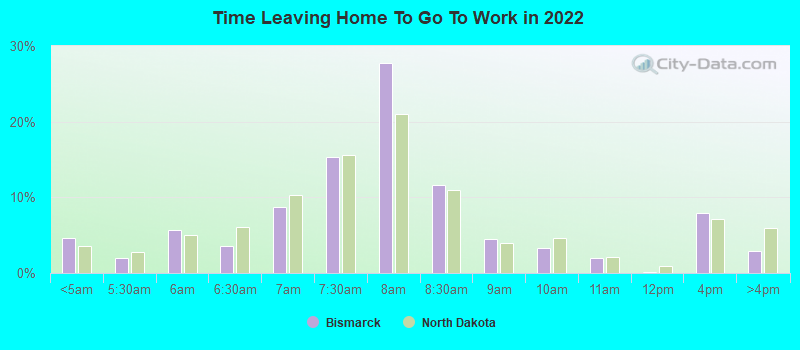
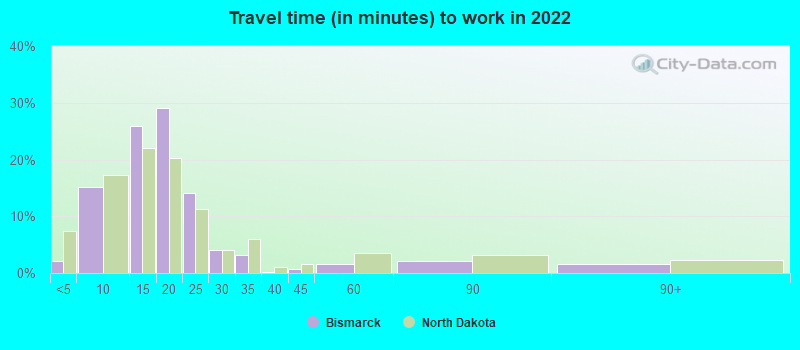
Travel time to work (commute)
Less than 5 minutes: 9115 to 9 minutes: 6,38110 to 14 minutes: 11,28915 to 19 minutes: 9,22220 to 24 minutes: 3,94025 to 29 minutes: 76330 to 34 minutes: 28835 to 39 minutes: 040 to 44 minutes: 25645 to 59 minutes: 060 to 89 minutes: 27890 or more minutes: 776
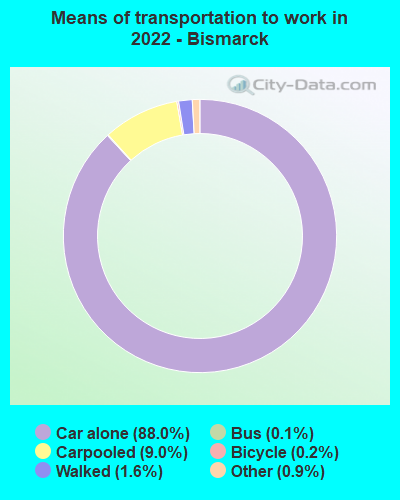
Means of transportation to work:
Drove a car alone: 40,793 (82.7%)Carpooled: 4,399 (8.9%)Bus : 45 (0.1%)Ferryboat: 5 (0.0%)Taxi: 335 (0.7%)Bicycle: 121 (0.2%)Walked: 825 (1.7%)Worked at home: 2,636 (5.3%)
Unemployment by race in 2022
Unemployment rate for White non-Hispanic residents 2.2% MalesUnemployment rate for Black residents 0.7% Males7.5% FemalesUnemployment rate for American Indian and Alaska Native residents 27.1% Males22.2% FemalesUnemployment rate for Asian residents 5.9% Males0.7% FemalesUnemployment rate for other race residents 4.8% FemalesUnemployment rate for two or more race residents 3.5% Males0.4% FemalesUnemployment rate for Hispanic or Latino residents 2.3% Males4.7% Females
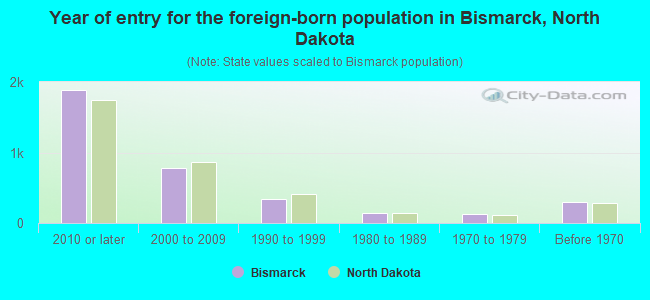
Year of entry for the foreign-born population in Bismarck, North Dakota
1,889 2010 or later 778 2000 to 2009 336 1990 to 1999 143 1980 to 1989 126 1970 to 1979 298 Before 1970
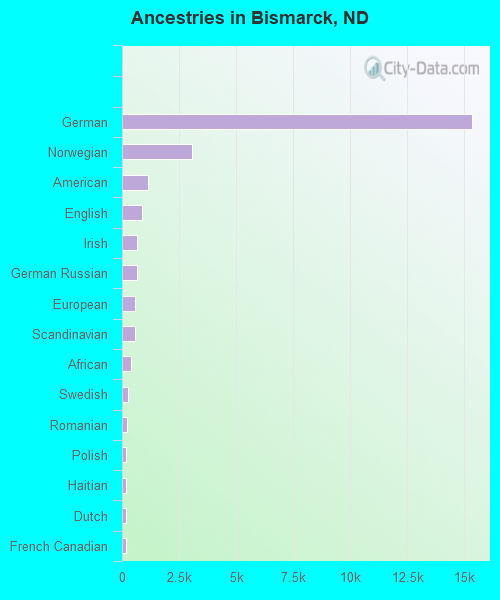
First ancestries reported:
German: 15,328 (48.4%)
Norwegian: 3,074 (9.7%)
American: 1,128 (3.6%)
English: 874 (2.8%)
Irish: 664 (2.1%)
German Russian: 639 (2.0%)
European: 585 (1.8%)
Scandinavian: 579 (1.8%)
African: 410 (1.3%)
Swedish: 279 (0.9%)
Romanian: 229 (0.7%)
Polish: 165 (0.5%)
Haitian: 165 (0.5%)
Dutch: 161 (0.5%)
French Canadian: 161 (0.5%)
French: 133 (0.4%)
Ukrainian: 122 (0.4%)
Italian: 106 (0.3%)
Kenyan: 100 (0.3%)
Czech: 99 (0.3%)
Russian: 89 (0.3%)
Icelander: 82 (0.3%)
Croatian: 78 (0.2%)
British: 77 (0.2%)
Lebanese: 68 (0.2%)
Danish: 58 (0.2%)
Serbian: 51 (0.2%)
Finnish: 47 (0.1%)
Hungarian: 45 (0.1%)
Scotch-Irish: 42 (0.1%)
Scottish: 34 (0.1%)
Yugoslavian: 34 (0.1%)
Northern European: 32 (0.1%)
Liberian: 31 (0.10%)
Nigerian: 29 (0.09%)
Afghan: 28 (0.09%)
Jamaican: 18 (0.06%)
Austrian: 16 (0.05%)
Portuguese: 16 (0.05%)
Ethiopian: 16 (0.05%)
Canadian: 16 (0.05%)
Slovene: 14 (0.04%)
Albanian: 11 (0.03%)
Ghanaian: 11 (0.03%)
Swiss: 9 (0.03%)
Pennsylvania German: 8 (0.03%)
Sudanese: 7 (0.02%)
Most common places of birth for foreign-born residents (%): Philippines Bismarck:
10.6% (322)North Dakota:
6.9% (2,472)
Germany Bismarck:
10.3% (314)North Dakota:
2.1% (740)
Canada Bismarck:
10.3% (313)North Dakota:
8.7% (3,118)
Liberia Bismarck:
9.4% (286)North Dakota:
8.6% (3,094)
Haiti Bismarck:
5.7% (175)North Dakota:
0.7% (235)
Ivory Coast Bismarck:
4.5% (136)North Dakota:
1.2% (444)
Panama Bismarck:
4.3% (131)North Dakota:
0.7% (241)
Croatia Bismarck:
3.8% (117)North Dakota:
0.4% (136)
Thailand Bismarck:
3.5% (108)North Dakota:
0.8% (271)
South Africa Bismarck:
3.0% (92)North Dakota:
1.5% (525)
Kenya Bismarck:
3.0% (91)North Dakota:
4.3% (1,546)
Mexico Bismarck:
2.6% (79)North Dakota:
8.0% (2,889)
Romania Bismarck:
2.5% (77)North Dakota:
0.5% (193)
Marshall Islands Bismarck:
2.4% (74)North Dakota:
0.3% (115)
Somalia Bismarck:
2.3% (70)North Dakota:
4.2% (1,514)
China, excluding Hong Kong and Taiwan Bismarck:
2.0% (62)North Dakota:
2.2% (778)
Russia Bismarck:
1.9% (58)North Dakota:
0.8% (282)
Ukraine Bismarck:
1.7% (53)North Dakota:
0.3% (106)
El Salvador Bismarck:
1.5% (47)North Dakota:
0.3% (118)
Place of birth for U.S.-born residents:
This state: 51,659Other state: 16,527Northeast: 1,051Midwest: 8,831South: 2,050West: 4,595 85.0% of Bismarck residents lived in the same house 1 years ago.
Out of people who lived in different houses, 37.8% lived in this county.
Out of people who lived in different counties, 62.8% lived in North Dakota.
Bismarck:
85.0%State average:
84.2%
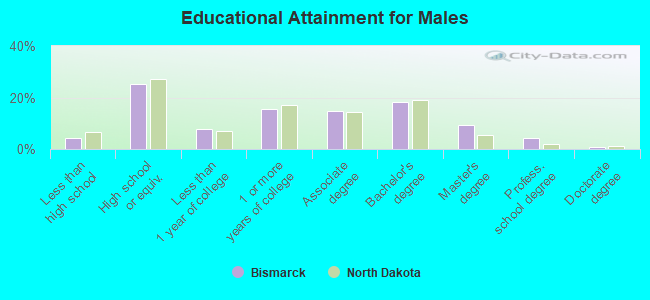
Education attainment for males 25 years and older:
No schooling: 61Nursery to 4th grade: 05th and 6th grade: 07th and 8th grade: 2179th grade: 20410th grade: 16111th grade: 38512th grade, no diploma: 0High school graduate (or equivalency): 6,378Less than 1 year of college: 1,994Some college more than 1 year, no degree: 3,871Associate degree: 3,686Bachelor's degree: 4,626Master's degree: 2,342Professional school degree: 1,037Doctorate degree: 237
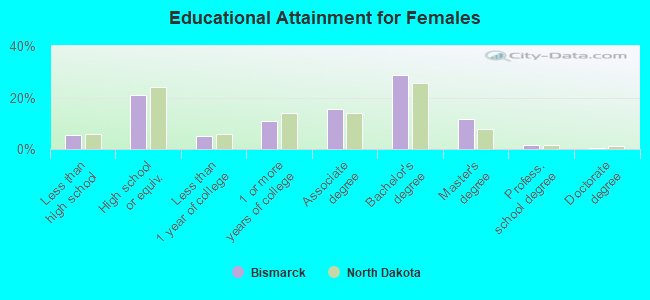
Education attainment for females 25 years and older:
No schooling: 556Nursery to 4th grade: 05th and 6th grade: 1457th and 8th grade: 3069th grade: 32210th grade: 011th grade: 2312th grade, no diploma: 67High school graduate (or equivalency): 5,326Less than 1 year of college: 1,329Some college more than 1 year, no degree: 2,818Associate degree: 3,942Bachelor's degree: 7,357Master's degree: 2,943Professional school degree: 360Doctorate degree: 58
Housing units in structures:
One, detached: 18,513One, attached: 2,266Two: 8033 or 4: 1,0495 to 9: 2,57010 to 19: 1,93820 to 49: 2,92450 or more: 2,803Mobile homes: 2,168Median worth of mobile homes: $34,363
Housing units lacking complete plumbing facilities in 2022: 0.3%Housing units lacking complete kitchen facilities in 2022: 0.3%House/condo owner moved in on average 10 years ago
Renter moved in on average 2 years ago
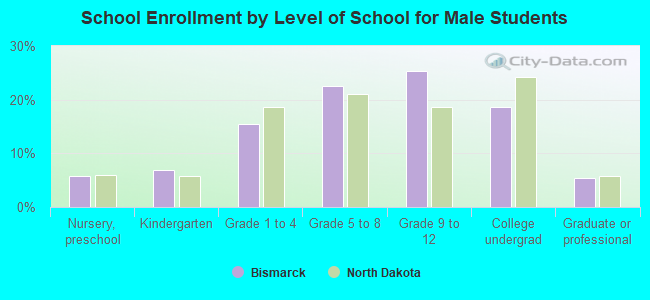
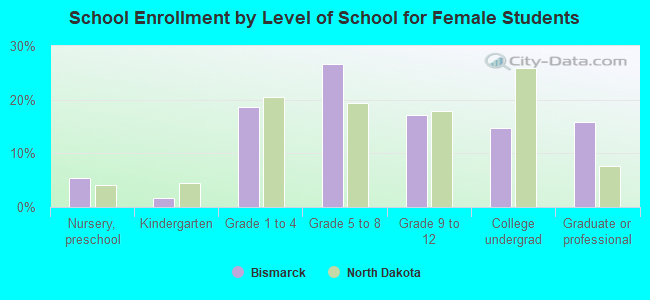
Private vs. public school enrollment:
Students in private schools in grades 1 to 8 (elementary and middle school): 724 Here:
10.3%North Dakota:
8.4%
Students in private schools in grades 9 to 12 (high school): 168 Here:
4.7%North Dakota:
8.2%
Students in private undergraduate colleges: 762 Here:
28.5%North Dakota:
14.3%