Bonnie, IL (Illinois) Houses and Residents
| Bonnie: | $82,288 |
| Illinois: | $251,600 |
Mean price in 2022:
Detached houses: $95,098
Here: $95,098 State: $310,164 Mobile homes: $35,077
Here: $35,077 State: $78,855
Total population: 389 (Urban population: 0, Rural population: 426 (all nonfarm))
Houses: 218 (180 occupied: 164 owner occupied, 18 renter occupied)
| % of renters here: | 10% |
| State: | 33% |
Housing density: 177 houses/condos per square mile
Median price asked for vacant for-sale houses and condos in 2022 in this county: $109,997.
Median contract rent in 2022: $649 (lower quartile is $434, upper quartile is $683)
Median gross rent in Bonnie, IL in 2022: $906
Housing units in Bonnie with a mortgage: 73 (4 second mortgage, 0 home equity loan, 0 both second mortgage and home equity loan)
Houses without a mortgage: 0
Median household income for houses/condos with a mortgage: $84,733
Median household income for apartments without a mortgage: $66,611
Median monthly housing costs: $598
Compare current foreclosures near Bonnie, IL:
| Photo | Address | Area | Beds / Baths | Price | Details |
|---|---|---|---|---|---|

|
#1
E Bonnie Rd
Bonnie, IL 62816
|
- sq. feet
|
- baths - beds |
show details | |

|
#2
N Spring Garden Ln
Bonnie, IL 62816
|
- sq. feet
|
- baths - beds |
show details | |

|
#3
S County Highway 13
Bonnie, IL 62816
|
- sq. feet
|
- baths - beds |
show details | |

|
#4
S 12th St
Mount Vernon, IL 62864
|
1,000 sq. feet
|
1 baths 2 beds |
$1
|
show details |

|
#5
North Illinois Highway 37
Mount Vernon, IL 62864
|
1,376 sq. feet
|
1 baths 3 beds |
show details | |

|
#6
N Mccauley Ln
Mount Vernon, IL 62864
|
2,364 sq. feet
|
3 baths 4 beds |
show details | |

|
#7
W Reed St
Benton, IL 62812
|
1,712 sq. feet
|
- baths 3 beds |
show details | |

|
#8
E Main St
Benton, IL 62812
|
1,008 sq. feet
|
1 baths 2 beds |
show details | |

|
#9
Airport Rd
Mount Vernon, IL 62864
|
- sq. feet
|
1 baths 3 beds |
show details | |

|
#10
E Beacon Ct
Mount Vernon, IL 62864
|
756 sq. feet
|
- baths - beds |
show details |
| Photo | Address | Area | Beds / Baths | Price | Details |
|---|---|---|---|---|---|

|
#11
Salem Rd
Mount Vernon, IL 62864
|
- sq. feet
|
- baths - beds |
show details | |

|
#12
N 6th St
Mount Vernon, IL 62864
|
- sq. feet
|
- baths - beds |
show details | |

|
#13
Northbrook Dr
Mount Vernon, IL 62864
|
- sq. feet
|
- baths - beds |
show details | |

|
#14
N Goshen Ln
Belle Rive, IL 62810
|
- sq. feet
|
- baths - beds |
show details | |

|
#15
N Stanford Ln
Opdyke, IL 62872
|
- sq. feet
|
- baths - beds |
show details | |

|
#16
E Bond St
Benton, IL 62812
|
- sq. feet
|
- baths - beds |
show details | |

|
#17
N Woods Pl
Mount Vernon, IL 62864
|
- sq. feet
|
- baths - beds |
show details | |

|
#18
N Mcleansboro St
Benton, IL 62812
|
- sq. feet
|
- baths - beds |
show details | |

|
#19
E Richview Rd
Mount Vernon, IL 62864
|
- sq. feet
|
- baths - beds |
show details | |

|
#20
Grammer Hill Rd
Benton, IL 62812
|
- sq. feet
|
- baths - beds |
show details |
| Photo | Address | Area | Beds / Baths | Price | Details |
|---|---|---|---|---|---|

|
#21
W Florence St
Sesser, IL 62884
|
- sq. feet
|
- baths - beds |
show details | |

|
#22
Fairland St
Benton, IL 62812
|
- sq. feet
|
- baths - beds |
show details | |

|
#23
Long Prairie Rd
Benton, IL 62812
|
- sq. feet
|
- baths - beds |
show details | |

|
#24
Hunters Cir
Benton, IL 62812
|
- sq. feet
|
- baths - beds |
show details | |

|
#25
N Woodlawn Ln
Woodlawn, IL 62898
|
- sq. feet
|
- baths - beds |
show details | |

|
#26
N 5th St
Dahlgren, IL 62828
|
- sq. feet
|
- baths - beds |
show details | |

|
#27
Hunters Cir
Benton, IL 62812
|
- sq. feet
|
- baths - beds |
show details | |

|
#28
W 5th St
Bluford, IL 62814
|
- sq. feet
|
- baths - beds |
show details | |

|
#29
Cumberland Pike Apt B
Mount Vernon, IL 62864
|
- sq. feet
|
- baths - beds |
show details | |

|
#30
Frontage Rd
Mount Vernon, IL 62864
|
- sq. feet
|
- baths - beds |
show details |
| Photo | Address | Area | Beds / Baths | Price | Details |
|---|---|---|---|---|---|

|
#31
County Road 275 E
Dahlgren, IL 62828
|
- sq. feet
|
- baths - beds |
show details | |

|
#32
N 9th St Apt 4
Mount Vernon, IL 62864
|
- sq. feet
|
- baths - beds |
show details | |

|
#33
G St
Mc Leansboro, IL 62859
|
- sq. feet
|
- baths - beds |
show details | |

|
#34
Colonial Dr
Mount Vernon, IL 62864
|
- sq. feet
|
- baths - beds |
show details | |

|
#35
S 20th St
Mount Vernon, IL 62864
|
- sq. feet
|
- baths - beds |
show details | |

|
#36
S 15th St
Mount Vernon, IL 62864
|
- sq. feet
|
- baths - beds |
show details | |

|
#37
Evergreen Dr
Mount Vernon, IL 62864
|
1,646 sq. feet
|
- baths - beds |
show details | |

|
#38
N Slim Ln
Ashley, IL 62808
|
- sq. feet
|
- baths - beds |
show details | |

|
#39
Rose Ln Apt 4
Mount Vernon, IL 62864
|
- sq. feet
|
- baths - beds |
show details | |

|
#40
Bishop Ct
Mount Vernon, IL 62864
|
- sq. feet
|
- baths - beds |
show details |
| Photo | Address | Area | Beds / Baths | Price | Details |
|---|---|---|---|---|---|

|
#41
Fairfield Rd
Mount Vernon, IL 62864
|
- sq. feet
|
- baths - beds |
show details | |

|
#42
E Webb Rd
Mount Vernon, IL 62864
|
- sq. feet
|
- baths - beds |
show details | |

|
#43
Election Dr
Benton, IL 62812
|
- sq. feet
|
- baths - beds |
show details | |

|
#44
E North Ave
Bluford, IL 62814
|
- sq. feet
|
- baths - beds |
show details | |

|
#45
N Miller St
Buckner, IL 62819
|
- sq. feet
|
- baths - beds |
show details | |

|
#46
N Mayflower Ln
Texico, IL 62889
|
- sq. feet
|
- baths - beds |
show details | |

|
#47
S Mcleansboro St
Benton, IL 62812
|
- sq. feet
|
- baths - beds |
show details | |

|
#48
E Blake St
Benton, IL 62812
|
- sq. feet
|
- baths - beds |
show details | |

|
#49
Bailey Ln
Benton, IL 62812
|
- sq. feet
|
- baths - beds |
show details | |

|
Check over 1 million property listings on Foreclosure.com!
|
browse all offers | |||

Latest news about housing in Bonnie, IL collected exclusively by city-data.com from local newspapers, TV, and radio stations

 | How safe is "downtown" Lockport? (23 replies) |
| Recommendations for Wheaton, Glen Ellyn, and Hinsdale (59 replies) |
| Need help finding a suburb! (10 replies) |
| Is Noble Square and East Village area about to get hot? (40 replies) |
| Logan Square on the verge of booming? (35 replies) |
| Some suburb pics (56K BEWARE!) (402 replies) |

Median year apartment built: 1955
Household type by relationship:
Households: 397- Male householders: 106 (32 living alone), Female householders: 71 (18 living alone)
92 spouses (92 opposite-sex spouses), 7 unmarried partners, (7 opposite-sex unmarried partners), 78 children (78 natural, 0 adopted, 0 stepchildren), 12 grandchildren, 4 brothers or sisters, 1 parents, 0 foster children, 1 other relatives, 18 non-relatives
Size of family households: 61 2-persons, 26 3-persons, 25 4-persons, 4 5-persons.
Size of nonfamily households: 54 1-person, 11 2-persons.
53 married couples with children.
8 single-parent households (3 men, 5 women).
94.5% of residents of Bonnie speak English at home.
4.7% of residents speak Spanish at home (72% speak English very well, 28% don't speak English at all).
0.5% of residents speak Asian or Pacific Island language at home (100% speak English well).
Foreign born population: 5 (1.3%)
(0.0% of them are naturalized citizens)
| Here: | 5.8 |
| State: | 6.4 |
| Here: | 5.0 |
| State: | 4.1 |

- Bedrooms in owner-occupied houses and condos in Bonnie, Illinois
- 0no bedroom
- 41 bedroom
- 512 bedrooms
- 963 bedrooms
- 104 bedrooms
- 45+ bedrooms

- Bedrooms in renter-occupied apartments in Bonnie, Illinois
- 0no bedroom
- 01 bedroom
- 112 bedrooms
- 73 bedrooms
- 04 bedrooms
- 05+ bedrooms

- Cars and other vehicles available in Bonnie in owner-occupied houses/condos
- 10no vehicle
- 361 vehicle
- 592 vehicles
- 463 vehicles
- 104 vehicles
- 45+ vehicles

- Cars and other vehicles available in Bonnie in renter-occupied apartments
- 7no vehicle
- 01 vehicle
- 92 vehicles
- 23 vehicles
- 04 vehicles
- 05+ vehicles

- Rooms in owner-occupied houses in Bonnie, Illinois
- 01 room
- 22 rooms
- 43 rooms
- 224 rooms
- 375 rooms
- 556 rooms
- 137 rooms
- 168 rooms
- 159+ rooms

- Rooms in renter-occupied apartments in Bonnie, Illinois
- 01 room
- 02 rooms
- 03 rooms
- 44 rooms
- 95 rooms
- 56 rooms
- 07 rooms
- 08 rooms
- 09+ rooms


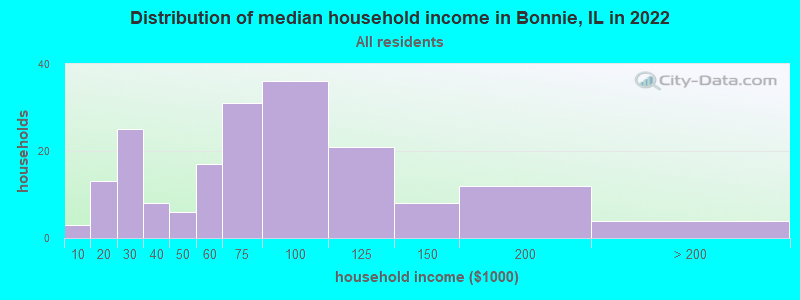
Bonnie, IL household income distribution

- 3Less than $10,000
- 13$10,000 to $19,999
- 25$20,000 to $29,999
- 8$30,000 to $39,999
- 6$40,000 to $49,999
- 17$50,000 to $59,999
- 31$60,000 to $74,999
- 36$75,000 to $99,999
- 21$100,000 to $124,999
- 8$125,000 to $149,999
- 12$150,000 to $199,999
- 4$200,000 or more
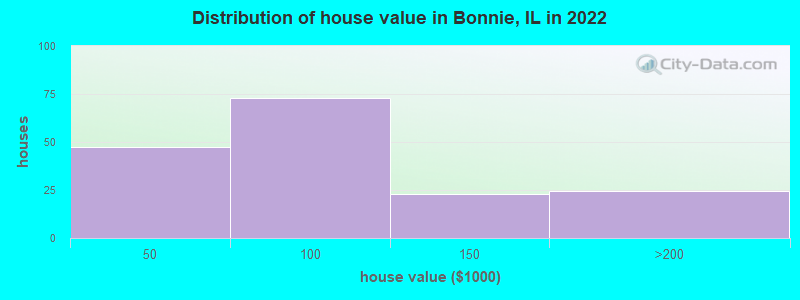
Home value of owner - occupied houses in 2022 in Bonnie, IL
-
- 4Less than $10,000
- 1$10,000 to $14,999
- 6$25,000 to $29,999
- 15$30,000 to $34,999
- 8$35,000 to $39,999
- 11$40,000 to $49,999
- 10$50,000 to $59,999
- 7$60,000 to $69,999
- 17$70,000 to $79,999
- 15$80,000 to $89,999
- 9$90,000 to $99,999
- 21$100,000 to $124,999
- 1$125,000 to $149,999
- 8$150,000 to $174,999
- 16$175,000 to $199,999
Rent paid by renters in 2022 in Bonnie, IL
-
- 3$400 to $449
- 1$600 to $649
- 4$650 to $699
- 0$700 to $749
- 9No cash rent


Percentage of workers working in this county: 68.1%
Number of people working at home: 2 (1.0% of all workers)
Travel time to work (commute)
- Less than 5 minutes: 2
- 5 to 9 minutes: 2
- 10 to 14 minutes: 58
- 15 to 19 minutes: 52
- 20 to 24 minutes: 30
- 25 to 29 minutes: 12
- 30 to 34 minutes: 7
- 35 to 39 minutes: 3
- 40 to 44 minutes: 2
- 45 to 59 minutes: 8
- 60 to 89 minutes: 13
- 90 or more minutes: 0
Means of transportation to work:
- Drove a car alone: 162 (81.8%)
- Carpooled: 34 (17.2%)
- Other means: 2 (1.0%)

- Unemployment by race in 2022
- Unemployment rate for White non-Hispanic residents
- 3.9%Males
- 4.4%Females

- Year of entry for the foreign-born population in Bonnie, Illinois
- 02010 or later
- 52000 to 2009
- 01990 to 1999
- 21980 to 1989
- 01970 to 1979
- 2Before 1970

First ancestries reported:
- German: 46 (23.4%)
- English: 44 (22.4%)
- American: 37 (18.8%)
- Irish: 19 (9.7%)
- Scotch-Irish: 4 (2.0%)
- British: 1 (0.5%)
- Italian: 1 (0.5%)
- Russian: 1 (0.5%)
- Scottish: 1 (0.5%)
Most common places of birth for foreign-born residents (%):
| Bonnie: | 100.0% (5) |
| Illinois: | 0.1% (1,902) |
Place of birth for U.S.-born residents:
- This state: 327
- Other state: 60
- Northeast: 0
- Midwest: 40
- South: 12
- West: 8
91.3% of Bonnie residents lived in the same house 1 years ago.
Out of people who lived in different houses, 44.6% lived in this county.
Out of people who lived in different counties, 33.3% lived in Illinois.
| Bonnie: | 91.3% |
| State average: | 88.3% |
Education attainment for males 25 years and older:
- No schooling: 0
- Nursery to 4th grade: 0
- 5th and 6th grade: 0
- 7th and 8th grade: 0
- 9th grade: 3
- 10th grade: 0
- 11th grade: 1
- 12th grade, no diploma: 4
- High school graduate (or equivalency): 62
- Less than 1 year of college: 18
- Some college more than 1 year, no degree: 19
- Associate degree: 16
- Bachelor's degree: 24
- Master's degree: 0
- Professional school degree: 0
- Doctorate degree: 3

Education attainment for females 25 years and older:
- No schooling: 2
- Nursery to 4th grade: 0
- 5th and 6th grade: 12
- 7th and 8th grade: 1
- 9th grade: 0
- 10th grade: 6
- 11th grade: 0
- 12th grade, no diploma: 1
- High school graduate (or equivalency): 59
- Less than 1 year of college: 23
- Some college more than 1 year, no degree: 17
- Associate degree: 18
- Bachelor's degree: 9
- Master's degree: 0
- Professional school degree: 0
- Doctorate degree: 0


Housing units in structures:
- One, detached: 141
- Mobile homes: 74
- Boats, RVs, vans, etc.: 2
Median worth of mobile homes: $70,704
Housing units lacking complete kitchen facilities in 2022: 6.0%
House/condo owner moved in on average 11 years ago
Renter moved in on average 9 years ago

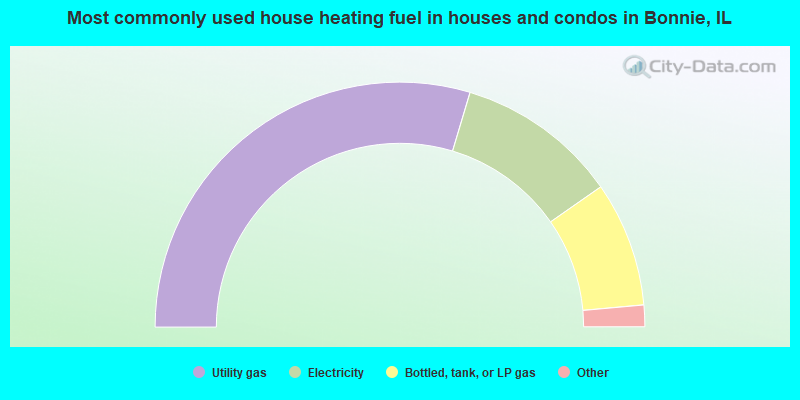
- 59.9%Utility gas
- 21.6%Electricity
- 16.7%Bottled, tank, or LP gas
- 1.2%Fuel oil, kerosene, etc.
- 0.6%Wood
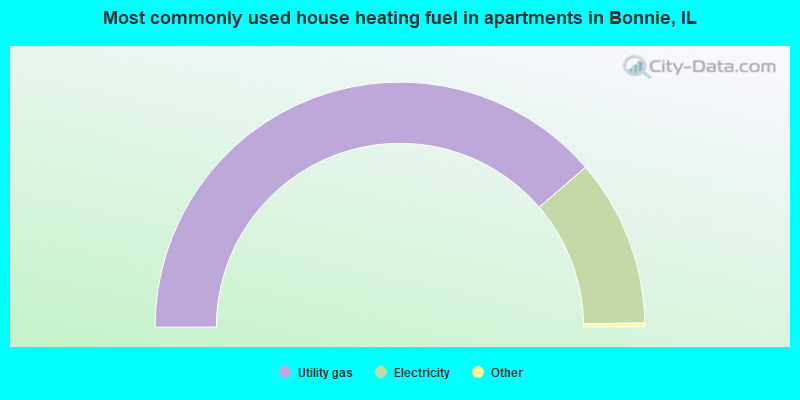
- 77.8%Utility gas
- 22.2%Electricity
Private vs. public school enrollment:
| Here: | 0.0% |
| Illinois: | 13.3% |
| Here: | 0.0% |
| Illinois: | 9.9% |
| Here: | 0.0% |
| Illinois: | 27.4% |


