Bristol, TN (Tennessee) Houses and Residents
Estimated median house or condo value in 2022: $200,252 (it was $68,700 in 2000 )
Bristol:
$200,252Tennessee:
$284,800
Lower value quartile - upper value quartile: $107,741 - $283,690Mean price in 2022: Detached houses: $257,558 Here:
$257,558State:
$374,382
Townhouses or other attached units: $169,080 Here:
$169,080State:
$354,101
In 2-unit structures: $159,063 Here:
$159,063State:
$247,693
In 3-to-4-unit structures: $132,405 Here:
$132,405State:
$239,060
In 5-or-more-unit structures: $94,288 Here:
$94,288State:
$317,434
Mobile homes: $33,252 Here:
$33,252State:
$101,421
Total population: 26,729 (Urban population: 23,714, Rural population: 1,269 (all nonfarm) )
Houses: 13,182 (11,948 occupied: 8,067 owner occupied, 4,171 renter occupied )
% of renters here:
34%State:
33%
Housing density: 449 houses/condos per square mile
Median price asked for vacant for-sale houses and condos in 2022: $151,988.
Median contract rent in 2022: $615 (lower quartile is $453, upper quartile is $787)
Median rent asked for vacant for-rent units in 2022: $830
Median gross rent in Bristol, TN in 2022: $783
Housing units in Bristol with a mortgage: 4,157 (242 second mortgage, 0 home equity loan, 184 both second mortgage and home equity loan )Houses without a mortgage: 85
Median household income for houses/condos with a mortgage: $70,619
Median household income for apartments without a mortgage: $50,902
Median monthly housing costs: $718
Data:
Median house or condo value ($)
Median house or condo value ($ change since 2000)
Median house or condo value ($) - White
Median house or condo value ($) - Black or African American
Median house or condo value ($) - Asian
Median house or condo value ($) - Hispanic or Latino
Median house or condo value ($) - American Indian and Alaska Native
Median house or condo value ($) - Multirace
Median house or condo value ($) - Other Race
Median price asked for mobile homes ($)
Household density (households per square mile)
Mean house or condo value by units in structure - 1, detached ($)
Mean house or condo value by units in structure - 1, attached ($)
Mean house or condo value by units in structure - 2 ($)
Mean house or condo value by units in structure by units in structure - 3 or 4 ($)
Mean house or condo value by units in structure - 5 or more ($)
Mean house or condo value by units in structure - Boat, RV, van, etc. ($)
Mean house or condo value by units in structure - Mobile home ($)
Median contract rent ($)
Median contract rent - Lower quartile ($)
Median contract rent - Upper quartile ($)
Median gross rent ($)
Urban houses (%)
Rural houses (%)
Houses occupied (%)
Houses occupied (% change since 2000)
Houses owner occupied (%)
Houses owner occupied (% change since 2000)
Houses renter occupied (%)
Houses renter occupied (% change since 2000)
Vacant housing units - For rent (%)
Vacant housing units - For rent (% change since 2000)
Vacant housing units - For sale only (%)
Vacant housing units - For sale only (% change since 2000)
Vacant housing units - Rented or sold, not occupied (%)
Vacant housing units - Rented or sold, not occupied (% change since 2000)
Vacant housing units - For seasonal, recreational, or occasional use (%)
Vacant housing units - For seasonal, recreational, or occasional use (% change since 2000)
Vacant housing units - For migrant workers (%)
Vacant housing units - For migrant workers (% change since 2000)
Vacant housing units - Other vacant (%)
Vacant housing units - Other vacant (% change since 2000)
Median monthly housing costs ($)
Median household income for houses/condos with a mortgage ($)
Median household income for houses/condos without a mortgage ($)
Median household income ($)
Median household income ($) - White
Median household income ($) - Black or African American
Median household income ($) - Asian
Median household income ($) - Hispanic or Latino
Median household income ($) - American Indian and Alaska Native
Median household income ($) - Multirace
Median household income ($) - Other Race
Mortgage status - with mortgage (%)
Mortgage status - with second mortgage (%)
Mortgage status - with home equity loan (%)
Mortgage status - with both second mortgage and home equity loan (%)
Mortgage status - without a mortgage (%)
Median year house/condo built
Median year apartment built
Household type by relationship - Male householder living alone (%)
Household type by relationship - Male householder not living alone (%)
Household type by relationship - Female householder living alone (%)
Household type by relationship - Female householder not living alone (%)
Household type by relationship - Opposite-Sex spouse (%)
Household type by relationship - Same-Sex spouse (%)
Household type by relationship - Opposite-Sex unmarried partner (%)
Household type by relationship - Same-Sex unmarried partner (%)
Household type by relationship - In group quarters (%)
Size of family households - 2-person household (%)
Size of family households - 3-person household (%)
Size of family households - 4-person household (%)
Size of family households - 5-person household (%)
Size of family households - 6-person household (%)
Size of family households - 7-or-more-person household (%)
Size of nonfamily households - 1-person household (%)
Size of nonfamily households - 2-person household (%)
Size of nonfamily households - 3-person household (%)
Size of nonfamily households - 4-person household (%)
Size of nonfamily households - 5-person household (%)
Size of nonfamily households - 6-person household (%)
Size of nonfamily households - 7-or-moreperson household (%)
Year house built - Built 2010 or later (%)
Year house built - Built 2000 to 2009 (%)
Year house built - Built 1990 to 1999 (%)
Year house built - Built 1980 to 1989 (%)
Year house built - Built 1970 to 1979 (%)
Year house built - Built 1960 to 1969 (%)
Year house built - Built 1950 to 1959 (%)
Year house built - Built 1940 to 1949 (%)
Year house built - Built 1939 or earlier (%)
Median number of rooms in houses and condos
Median number of rooms in apartments
Median number of bedrooms in owner occupied houses
Mean number of bedrooms in owner occupied houses
Median number of bedrooms in renter occupied houses
Mean number of bedrooms in renter occupied houses
Median number of vehichles in owner occupied houses
Mean number of vehichles in owner occupied houses
Median number of vehichles in renter occupied houses
Mean number of vehichles in renter occupied houses
Rooms in owner-occupied houses - 1 room (%)
Rooms in owner-occupied houses - 2 rooms (%)
Rooms in owner-occupied houses - 3 rooms (%)
Rooms in owner-occupied houses - 4 rooms (%)
Rooms in owner-occupied houses - 5 rooms (%)
Rooms in owner-occupied houses - 6 rooms (%)
Rooms in owner-occupied houses - 7 rooms (%)
Rooms in owner-occupied houses - 8 rooms (%)
Rooms in owner-occupied houses - 9+ rooms (%)
Rooms in renter-occupied houses - 1 room (%)
Rooms in renter-occupied houses - 2 rooms (%)
Rooms in renter-occupied houses - 3 rooms (%)
Rooms in renter-occupied houses - 4 rooms (%)
Rooms in renter-occupied houses - 5 rooms (%)
Rooms in renter-occupied houses - 6 rooms (%)
Rooms in renter-occupied houses - 7 rooms (%)
Rooms in renter-occupied houses - 8 rooms (%)
Rooms in renter-occupied houses - 9+ rooms (%)
Bedrooms in owner-occupied houses - no bedrooms (%)
Bedrooms in owner-occupied houses - 1 bedroom (%)
Bedrooms in owner-occupied houses - 2 bedrooms (%)
Bedrooms in owner-occupied houses - 3 bedrooms (%)
Bedrooms in owner-occupied houses - 4 bedrooms (%)
Bedrooms in owner-occupied houses - 5+ bedrooms (%)
Bedrooms in renter-occupied houses - no bedrooms (%)
Bedrooms in renter-occupied houses - 1 bedroom (%)
Bedrooms in renter-occupied houses - 2 bedrooms (%)
Bedrooms in renter-occupied houses - 3 bedrooms (%)
Bedrooms in renter-occupied houses - 4 bedrooms (%)
Bedrooms in renter-occupied houses - 5+ bedrooms (%)
Vehicles available in owner-occupied houses - no vehicle available (%)
Vehicles available in owner-occupied houses - 1 vehicle available(%)
Vehicles available in owner-occupied houses - 2 Vehicles available (%)
Vehicles available in owner-occupied houses - 3 Vehicles available (%)
Vehicles available in owner-occupied houses - 4 Vehicles available (%)
Vehicles available in owner-occupied houses - 5+ Vehicles available (%)
Vehicles available in renter-occupied houses - no vehicle available (%)
Vehicles available in renter-occupied houses - 1 vehicle available (%)
Vehicles available in renter-occupied houses - 2 Vehicles available (%)
Vehicles available in renter-occupied houses - 3 Vehicles available (%)
Vehicles available in renter-occupied houses - 4 Vehicles available (%)
Vehicles available in renter-occupied houses - 5+ Vehicles available (%)
Housing units in structures - 1, detached (%)
Housing units in structures - 1, attached (%)
Housing units in structures - 2 (%)
Housing units in structures - 3 or 4 (%)
Housing units in structures - 5 to 9 (%)
Housing units in structures - 10 to 19 (%)
Housing units in structures - 20 to 49 (%)
Housing units in structures - 50 or more (%)
Housing units in structures - Mobile home (%)
Housing units in structures - Boat, RV, van, etc. (%)
Housing units in structures - Owners - 1, detached (%)
Housing units in structures - Owners - 1, attached (%)
Housing units in structures - Owners - 2 (%)
Housing units in structures - Owners - 3 or 4 (%)
Housing units in structures - Owners - 5 to 9 (%)
Housing units in structures - Owners - 10 to 19 (%)
Housing units in structures - Owners - 20 to 49 (%)
Housing units in structures - Owners - 50 or more (%)
Housing units in structures - Owners - Mobile home (%)
Housing units in structures - Owners - Boat, RV, van, etc. (%)
Housing units in structures - Renters - 1, detached (%)
Housing units in structures - Renters - 1, attached (%)
Housing units in structures - Renters - 2 (%)
Housing units in structures - Renters - 3 or 4 (%)
Housing units in structures - Renters - 5 to 9 (%)
Housing units in structures - Renters - 10 to 19 (%)
Housing units in structures - Renters - 20 to 49 (%)
Housing units in structures - Renters - 50 or more (%)
Housing units in structures - Renters - Mobile home (%)
Housing units in structures - Renters - Boat, RV, van, etc. (%)
House/condo owner moved in on average (years ago)
Renter moved in on average (years ago)
Year householder moved into unit - Moved in 1999 to March 2000 (%)
Year householder moved into unit - Moved in 1999 to March 2000 (%) - White
Year householder moved into unit - Moved in 1999 to March 2000 (%) - Black or African American
Year householder moved into unit - Moved in 1999 to March 2000 (%) - Asian
Year householder moved into unit - Moved in 1999 to March 2000 (%) - Hispanic or Latino
Year householder moved into unit - Moved in 1999 to March 2000 (%) - American Indian and Alaska Native
Year householder moved into unit - Moved in 1999 to March 2000 (%) - Multirace
Year householder moved into unit - Moved in 1999 to March 2000 (%) - Other Race
Year householder moved into unit - Moved in 1995 to 1998 (%)
Year householder moved into unit - Moved in 1995 to 1998 (%) - White
Year householder moved into unit - Moved in 1995 to 1998 (%) - Black or African American
Year householder moved into unit - Moved in 1995 to 1998 (%) - Asian
Year householder moved into unit - Moved in 1995 to 1998 (%) - Hispanic or Latino
Year householder moved into unit - Moved in 1995 to 1998 (%) - American Indian and Alaska Native
Year householder moved into unit - Moved in 1995 to 1998 (%) - Multirace
Year householder moved into unit - Moved in 1995 to 1998 (%) - Other Race
Year householder moved into unit - Moved in 1990 to 1994 (%)
Year householder moved into unit - Moved in 1990 to 1994 (%) - White
Year householder moved into unit - Moved in 1990 to 1994 (%) - Black or African American
Year householder moved into unit - Moved in 1990 to 1994 (%) - Asian
Year householder moved into unit - Moved in 1990 to 1994 (%) - Hispanic or Latino
Year householder moved into unit - Moved in 1990 to 1994 (%) - American Indian and Alaska Native
Year householder moved into unit - Moved in 1990 to 1994 (%) - Multirace
Year householder moved into unit - Moved in 1990 to 1994 (%) - Other Race
Year householder moved into unit - Moved in 1980 to 1989 (%)
Year householder moved into unit - Moved in 1980 to 1989 (%) - White
Year householder moved into unit - Moved in 1980 to 1989 (%) - Black or African American
Year householder moved into unit - Moved in 1980 to 1989 (%) - Asian
Year householder moved into unit - Moved in 1980 to 1989 (%) - Hispanic or Latino
Year householder moved into unit - Moved in 1980 to 1989 (%) - American Indian and Alaska Native
Year householder moved into unit - Moved in 1980 to 1989 (%) - Multirace
Year householder moved into unit - Moved in 1980 to 1989 (%) - Other Race
Year householder moved into unit - Moved in 1970 to 1979 (%)
Year householder moved into unit - Moved in 1970 to 1979 (%) - White
Year householder moved into unit - Moved in 1970 to 1979 (%) - Black or African American
Year householder moved into unit - Moved in 1970 to 1979 (%) - Asian
Year householder moved into unit - Moved in 1970 to 1979 (%) - Hispanic or Latino
Year householder moved into unit - Moved in 1970 to 1979 (%) - American Indian and Alaska Native
Year householder moved into unit - Moved in 1970 to 1979 (%) - Multirace
Year householder moved into unit - Moved in 1970 to 1979 (%) - Other Race
Year householder moved into unit - Moved in 1969 or earlier (%)
Year householder moved into unit - Moved in 1969 or earlier (%) - White
Year householder moved into unit - Moved in 1969 or earlier (%) - Black or African American
Year householder moved into unit - Moved in 1969 or earlier (%) - Asian
Year householder moved into unit - Moved in 1969 or earlier (%) - Hispanic or Latino
Year householder moved into unit - Moved in 1969 or earlier (%) - American Indian and Alaska Native
Year householder moved into unit - Moved in 1969 or earlier (%) - Multirace
Year householder moved into unit - Moved in 1969 or earlier (%) - Other Race
Housing units lacking complete plumbing facilities (%)
Housing units lacking complete kitchen facilities (%)
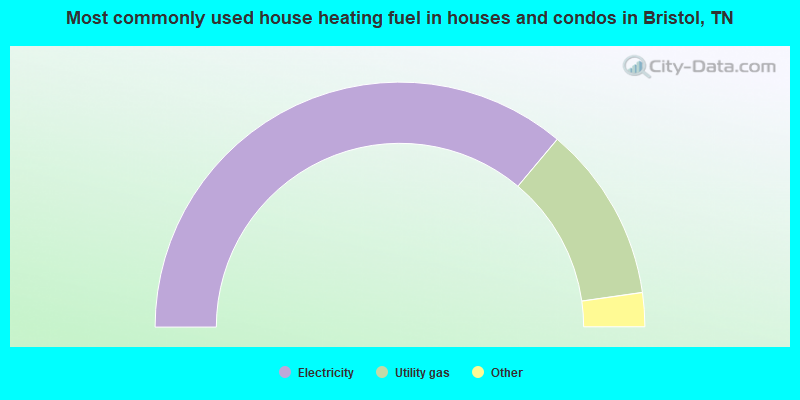
House heating fuel used in houses and condos - Utility gas (%)
House heating fuel used in houses and condos - Bottled, tank, or LP gas (%)
House heating fuel used in houses and condos - Electricity (%)
House heating fuel used in houses and condos - Fuel oil, kerosene, etc. (%)
House heating fuel used in houses and condos - Coal or coke (%)
House heating fuel used in houses and condos - Wood (%)
House heating fuel used in houses and condos - Solar energy (%)
House heating fuel used in houses and condos - Other fuel (%)
House heating fuel used in houses and condos - No fuel used (%)
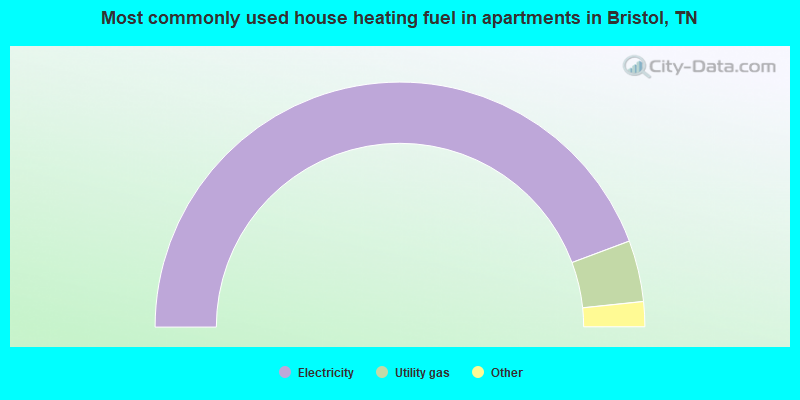
House heating fuel used in apartments - Utility gas (%)
House heating fuel used in apartments - Bottled, tank, or LP gas (%)
House heating fuel used in apartments - Electricity (%)
House heating fuel used in apartments - Fuel oil, kerosene, etc. (%)
House heating fuel used in apartments - Coal or coke (%)
House heating fuel used in apartments - Wood (%)
House heating fuel used in apartments - Solar energy (%)
House heating fuel used in apartments - Other fuel (%)
House heating fuel used in apartments - No fuel used (%)
Latest news about housing in Bristol, TN collected exclusively by city-data.com from local newspapers, TV, and radio stations
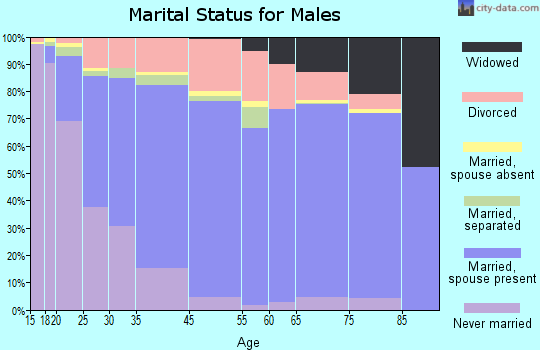
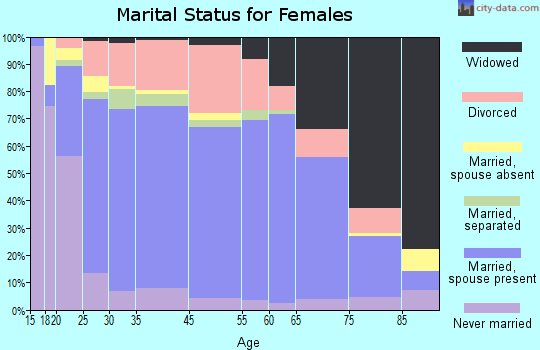
Median year house/condo built: 1966Median year apartment built: 1974Household type by relationship:
Households: 27,667
Male householders: 5,679 (1,860 living alone ), Female householders: 6,342 (2,444 living alone )4,836 spouses (4,763 opposite-sex spouses ), 833 unmarried partners , (823 opposite-sex unmarried partners ), 7,293 children (6,467 natural , 185 adopted , 640 stepchildren ), 628 grandchildren , 343 brothers or sisters , 279 parents , 4 foster children , 349 other relatives , 453 non-relatives In group quarters: 624
Size of family households: 4,022 2-persons , 1,588 3-persons , 1,016 4-persons , 415 5-persons , 221 6-persons , 187 7-or-more-persons .
Size of nonfamily households: 4,239 1-person , 436 2-persons , 33 3-persons , 73 4-persons .
2,930 married couples with children. single-parent households (429 men , 1,521 women ).
97.1% of residents of Bristol speak English at home. of residents speak Spanish at home (56% speak English very well , 30% speak English well , 14% speak English not well ).of residents speak other Indo-European language at home (93% speak English very well , 7% speak English well ).of residents speak Asian or Pacific Island language at home (92% speak English very well , 8% speak English well ).of residents speak other language at home (100% speak English very well ).
Foreign born population: 623 (2.3%)of them are naturalized citizens )
Median number of rooms in houses and condos:
Median number of rooms in apartments
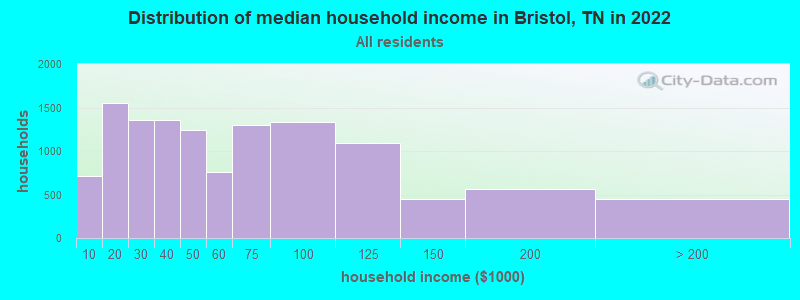
Bristol, TN household income distribution 715 Less than $10,0001,555 $10,000 to $19,9991,355 $20,000 to $29,9991,352 $30,000 to $39,9991,245 $40,000 to $49,999762 $50,000 to $59,9991,295 $60,000 to $74,9991,333 $75,000 to $99,9991,092 $100,000 to $124,999446 $125,000 to $149,999559 $150,000 to $199,999444 $200,000 or more
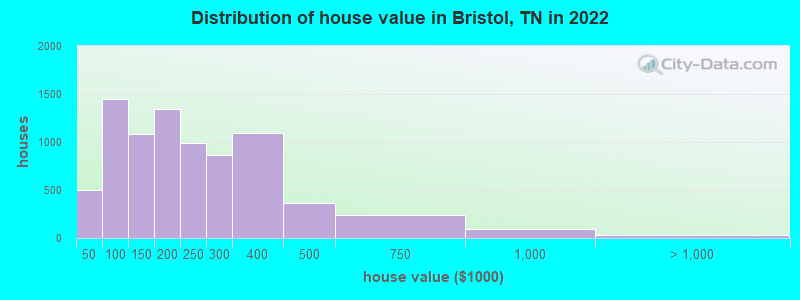
Home value of owner - occupied houses in 2022 in Bristol, TN 217 Less than $10,00084 $10,000 to $14,99917 $15,000 to $19,99964 $20,000 to $24,99938 $25,000 to $29,9993 $30,000 to $34,99972 $40,000 to $49,999179 $50,000 to $59,999187 $60,000 to $69,999370 $70,000 to $79,999370 $80,000 to $89,999270 $90,000 to $99,999601 $100,000 to $124,999481 $125,000 to $149,999686 $150,000 to $174,999657 $175,000 to $199,999986 $200,000 to $249,999862 $250,000 to $299,9991,097 $300,000 to $399,999365 $400,000 to $499,999235 $500,000 to $749,99989 $750,000 to $999,99921 $1,000,000 to $1,499,9998 $2,000,000 or moreRent paid by renters in 2022 in Bristol, TN 75 $150 to $199104 $200 to $24962 $250 to $299117 $300 to $349108 $350 to $399427 $400 to $449256 $450 to $499544 $500 to $549115 $550 to $599282 $600 to $649501 $650 to $699151 $700 to $749206 $750 to $799367 $800 to $899351 $900 to $999147 $1,000 to $1,24932 $1,250 to $1,49933 $1,500 to $1,999284 No cash rent
Percentage of workers working in this county: 65.7%Number of people working at home: 1,409 (11.6% of all workers )
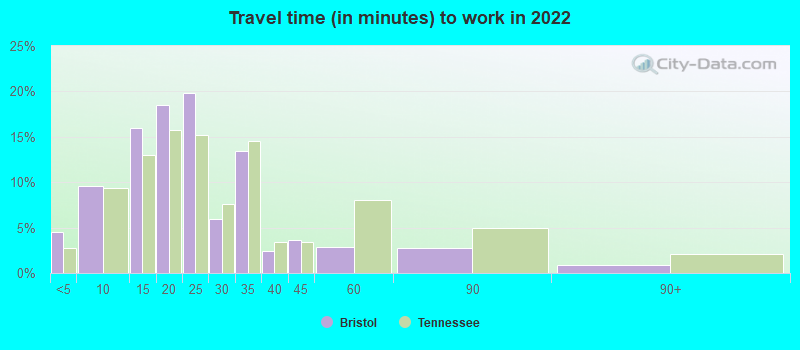
Travel time to work (commute)
Less than 5 minutes: 5495 to 9 minutes: 1,58010 to 14 minutes: 1,79815 to 19 minutes: 1,72520 to 24 minutes: 1,28225 to 29 minutes: 59730 to 34 minutes: 1,34335 to 39 minutes: 33640 to 44 minutes: 49945 to 59 minutes: 36060 to 89 minutes: 8390 or more minutes: 207
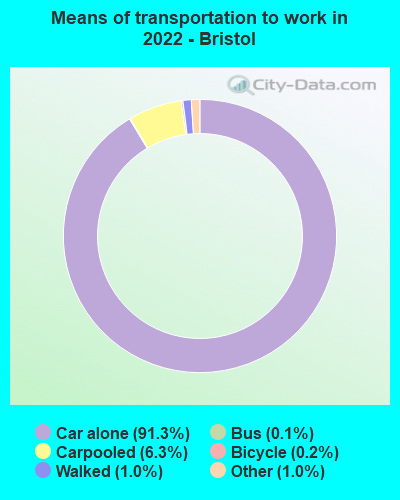
Means of transportation to work:
Drove a car alone: 14,081 (81.8%)Carpooled: 1,028 (6.0%)Bus : 19 (0.1%)Subway or elevated rail : 20 (0.1%)Taxi: 188 (1.1%)Bicycle: 29 (0.2%)Walked: 158 (0.9%)Worked at home: 1,409 (8.2%)
Unemployment by race in 2022
Unemployment rate for White non-Hispanic residents 3.8% Males7.5% FemalesUnemployment rate for Black residents 13.8% Males15.5% FemalesUnemployment rate for American Indian and Alaska Native residents 100.0% MalesUnemployment rate for two or more race residents 24.7% Males11.4% FemalesUnemployment rate for Hispanic or Latino residents 4.1% Males1.3% Females
Year of entry for the foreign-born population in Bristol, Tennessee
187 2010 or later 121 2000 to 2009 89 1990 to 1999 90 1980 to 1989 38 1970 to 1979 63 Before 1970
First ancestries reported:
American: 4,040 (28.5%)
English: 3,546 (25.0%)
Irish: 1,700 (12.0%)
German: 1,232 (8.7%)
Scotch-Irish: 480 (3.4%)
Scottish: 415 (2.9%)
Italian: 360 (2.5%)
Jamaican: 144 (1.0%)
European: 132 (0.9%)
French: 68 (0.5%)
African: 48 (0.3%)
Dutch: 35 (0.2%)
Northern European: 34 (0.2%)
Czech: 29 (0.2%)
Eastern European: 25 (0.2%)
Polish: 25 (0.2%)
Swedish: 25 (0.2%)
Assyrian: 23 (0.2%)
Danish: 21 (0.1%)
Welsh: 18 (0.1%)
Cypriot: 15 (0.1%)
Iranian: 15 (0.1%)
Portuguese: 15 (0.1%)
British: 13 (0.09%)
Yugoslavian: 13 (0.09%)
Canadian: 12 (0.08%)
Finnish: 12 (0.08%)
Norwegian: 9 (0.06%)
Slovak: 7 (0.05%)
Ethiopian: 7 (0.05%)
Croatian: 6 (0.04%)
Trinidadian and Tobagonian: 6 (0.04%)
Austrian: 5 (0.04%)
Macedonian: 5 (0.04%) Most common places of birth for foreign-born residents (%): Mexico Bristol:
24.4% (136)Tennessee:
23.0% (86,435)
England Bristol:
15.9% (89)Tennessee:
1.2% (4,587)
Spain Bristol:
9.5% (53)Tennessee:
0.2% (698)
Australia Bristol:
9.1% (51)Tennessee:
0.3% (1,109)
Germany Bristol:
6.1% (34)Tennessee:
2.2% (8,261)
Cuba Bristol:
5.2% (29)Tennessee:
1.3% (4,841)
Honduras Bristol:
4.5% (25)Tennessee:
4.6% (17,433)
Guyana Bristol:
4.3% (24)Tennessee:
0.2% (596)
Philippines Bristol:
3.9% (22)Tennessee:
3.1% (11,640)
Canada Bristol:
3.9% (22)Tennessee:
2.7% (10,295)
Bosnia and Herzegovina Bristol:
2.9% (16)Tennessee:
0.3% (1,183)
Iran Bristol:
2.9% (16)Tennessee:
0.8% (2,872)
Other Western Asia Bristol:
2.7% (15)Tennessee:
0.0% (150)
China, excluding Hong Kong and Taiwan Bristol:
2.0% (11)Tennessee:
3.3% (12,582)
Colombia Bristol:
2.0% (11)Tennessee:
1.0% (3,879)
United Kingdom, excluding England and Scotland Bristol:
1.6% (9)Tennessee:
1.0% (3,809)
Place of birth for U.S.-born residents:
This state: 13,182Other state: 13,880Northeast: 1,169Midwest: 1,368South: 10,246West: 1,115 91.1% of Bristol residents lived in the same house 1 years ago.
Out of people who lived in different houses, 28.4% lived in this county.
Out of people who lived in different counties, 13.1% lived in Tennessee.
Bristol:
91.1%State average:
87.0%
Education attainment for males 25 years and older:
No schooling: 116Nursery to 4th grade: 05th and 6th grade: 947th and 8th grade: 389th grade: 5910th grade: 5811th grade: 14812th grade, no diploma: 47High school graduate (or equivalency): 3,233Less than 1 year of college: 727Some college more than 1 year, no degree: 1,294Associate degree: 674Bachelor's degree: 1,631Master's degree: 463Professional school degree: 193Doctorate degree: 165
Education attainment for females 25 years and older:
No schooling: 77Nursery to 4th grade: 195th and 6th grade: 317th and 8th grade: 1229th grade: 10010th grade: 12211th grade: 13112th grade, no diploma: 79High school graduate (or equivalency): 3,367Less than 1 year of college: 671Some college more than 1 year, no degree: 1,546Associate degree: 1,041Bachelor's degree: 2,027Master's degree: 705Professional school degree: 83Doctorate degree: 50
Housing units in structures:
One, detached: 7,815One, attached: 688Two: 9773 or 4: 7185 to 9: 98410 to 19: 39820 to 49: 23450 or more: 308Mobile homes: 1,019Boats, RVs, vans, etc.: 36Median worth of mobile homes: $26,946
Housing units lacking complete plumbing facilities in 2022: 1.3%Housing units lacking complete kitchen facilities in 2022: 1.9%House/condo owner moved in on average 10 years ago
Renter moved in on average 2 years ago
Private vs. public school enrollment:
Students in private schools in grades 1 to 8 (elementary and middle school): 233 Students in private schools in grades 9 to 12 (high school): 115 Students in private undergraduate colleges: 336 Here:
29.3%Tennessee:
23.5%