Brownsboro, TX (Texas) Houses and Residents
| Brownsboro: | $226,411 |
| Texas: | $275,400 |
Mean price in 2022:
Detached houses: $224,567
Here: $224,567 State: $369,058 Mobile homes: $85,724
Here: $85,724 State: $124,413
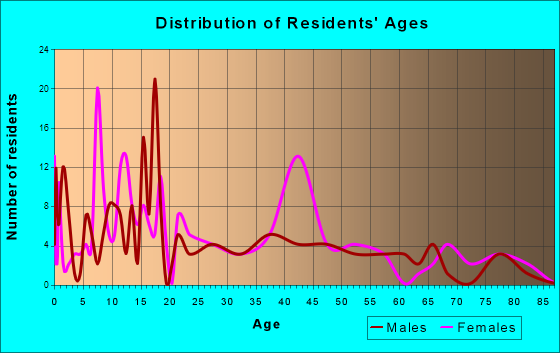
Total population: 1,065 (Urban population: 0, Rural population: 772 (all nonfarm))
Houses: 539 (504 occupied: 278 owner occupied, 243 renter occupied)
| % of renters here: | 47% |
| State: | 38% |
Housing density: 276 houses/condos per square mile
Median price asked for vacant for-sale houses and condos in 2022: $507,932.
Median contract rent in 2022: $1,210 (lower quartile is $737, upper quartile is $1,281)
Median rent asked for vacant for-rent units in 2022: $2,633
Median gross rent in Brownsboro, TX in 2022: $1,278
Housing units in Brownsboro with a mortgage: 124 (0 second mortgage, 0 home equity loan, 0 both second mortgage and home equity loan)
Houses without a mortgage: 0
Median household income for houses/condos with a mortgage: $114,088
Median household income for apartments without a mortgage: $76,281
Median monthly housing costs: $1,212
Compare current foreclosures near Brownsboro, TX:
| Photo | Address | Area | Beds / Baths | Price | Details |
|---|---|---|---|---|---|

|
#1
Fm 317
Brownsboro, TX 75756
|
1,595 sq. feet
|
- baths - beds |
show details | |

|
#2
607 Cr North
Brownsboro, TX 75756
|
- sq. feet
|
- baths - beds |
show details | |

|
#3
Skyline Dr
Brownsboro, TX 75756
|
2,214 sq. feet
|
- baths - beds |
show details | |

|
#4
Fm 314
Brownsboro, TX 75756
|
- sq. feet
|
- baths - beds |
show details | |

|
#5
Lakeview Dr
Lindale, TX 75771
|
3,796 sq. feet
|
3 baths 4 beds |
$429,000
|
show details |

|
#6
Saint Andrews Cir
Lindale, TX 75771
|
2,320 sq. feet
|
2 baths 3 beds |
show details | |

|
#7
Jak Ln
Chandler, TX 75758
|
1,654 sq. feet
|
2 baths 3 beds |
show details | |

|
#8
State Highway 31 E
Athens, TX 75752
|
3,926 sq. feet
|
3 baths 3 beds |
show details | |

|
#9
Sierra Ln
Chandler, TX 75758
|
1,560 sq. feet
|
2 baths 3 beds |
show details | |

|
#10
Guadalupe Dr
Athens, TX 75751
|
2,176 sq. feet
|
2 baths 3 beds |
show details |
| Photo | Address | Area | Beds / Baths | Price | Details |
|---|---|---|---|---|---|

|
#11
Ginger Dr
Lindale, TX 75771
|
1,217 sq. feet
|
2 baths 2 beds |
show details | |

|
#12
Mary Martin Dr
Flint, TX 75762
|
1,837 sq. feet
|
2 baths 3 beds |
show details | |

|
#13
Princess Pl
Tyler, TX 75704
|
1,631 sq. feet
|
2 baths - beds |
show details | |

|
#14
Westridge St
Tyler, TX 75709
|
2,000 sq. feet
|
2 baths - beds |
show details | |

|
#15
Indian Dr
Tyler, TX 75709
|
1,580 sq. feet
|
1 baths - beds |
show details | |

|
#16
Altuda Ln
Flint, TX 75762
|
1,814 sq. feet
|
2 baths - beds |
show details | |

|
#17
County Road 1145
Tyler, TX 75704
|
1,920 sq. feet
|
2 baths - beds |
show details | |

|
#18
Lakeview Cir
Flint, TX 75762
|
1,860 sq. feet
|
2 baths - beds |
show details | |

|
#19
Seton St
Flint, TX 75762
|
1,494 sq. feet
|
2 baths - beds |
show details | |

|
#20
County Road 1151
Tyler, TX 75704
|
1,592 sq. feet
|
2 baths - beds |
show details |
| Photo | Address | Area | Beds / Baths | Price | Details |
|---|---|---|---|---|---|

|
#21
Gentry St
Tyler, TX 75704
|
1,152 sq. feet
|
2 baths - beds |
show details | |

|
#22
Big Oak Dr
Flint, TX 75762
|
1,309 sq. feet
|
2 baths - beds |
show details | |

|
#23
County Road 48
Tyler, TX 75704
|
1,628 sq. feet
|
2 baths - beds |
show details | |

|
#24
Greenwood Trl
Bullard, TX 75757
|
2,428 sq. feet
|
3 baths - beds |
show details | |

|
#25
Macarthur St
Tyler, TX 75704
|
2,102 sq. feet
|
2 baths - beds |
show details | |

|
#26
County Road 133
Flint, TX 75762
|
1,817 sq. feet
|
2 baths - beds |
show details | |

|
#27
Rustic Rd
Lindale, TX 75771
|
1,766 sq. feet
|
2 baths - beds |
show details | |

|
#28
Leon Dr
Tyler, TX 75702
|
2,092 sq. feet
|
1 baths - beds |
show details | |

|
#29
Triple Crown Dr
Flint, TX 75762
|
1,615 sq. feet
|
2 baths - beds |
show details | |

|
#30
Lonetree Cir
Tyler, TX 75706
|
2,011 sq. feet
|
2 baths - beds |
show details |
| Photo | Address | Area | Beds / Baths | Price | Details |
|---|---|---|---|---|---|

|
#31
Bradshaw Dr
Tyler, TX 75702
|
1,355 sq. feet
|
1 baths - beds |
show details | |

|
#32
Sundown St
Tyler, TX 75709
|
1,244 sq. feet
|
2 baths - beds |
show details | |

|
#33
Sunset Dr
Tyler, TX 75704
|
1,989 sq. feet
|
1 baths - beds |
show details | |

|
#34
Fm 724
Tyler, TX 75704
|
1,008 sq. feet
|
1 baths - beds |
show details | |

|
#35
County Road 3414
Chandler, TX 75758
|
2,736 sq. feet
|
- baths - beds |
show details | |

|
#36
Fm 1861
Ben Wheeler, TX 75754
|
- sq. feet
|
- baths - beds |
show details | |

|
#37
Fm 16
Van, TX 75790
|
- sq. feet
|
- baths - beds |
show details | |

|
#38
County Road 428
Tyler, TX 75704
|
- sq. feet
|
- baths - beds |
show details | |

|
#39
Cross Rd
Tyler, TX 75703
|
- sq. feet
|
- baths - beds |
show details | |

|
#40
Chestnut Dr
Van, TX 75790
|
1,173 sq. feet
|
- baths - beds |
show details |
| Photo | Address | Area | Beds / Baths | Price | Details |
|---|---|---|---|---|---|

|
#41
Idaho St
Van, TX 75790
|
2,396 sq. feet
|
- baths - beds |
show details | |

|
#42
County Road 178
Flint, TX 75762
|
- sq. feet
|
- baths - beds |
show details | |

|
#43
State Highway 64 # 64
Ben Wheeler, TX 75754
|
1,630 sq. feet
|
- baths - beds |
show details | |

|
#44
Pecan Rdg
Chandler, TX 75758
|
1,904 sq. feet
|
- baths - beds |
show details | |

|
#45
N Prairieville St
Athens, TX 75751
|
- sq. feet
|
- baths - beds |
show details | |

|
#46
Vz County Road 4114
Canton, TX 75103
|
- sq. feet
|
- baths - beds |
show details | |

|
#47
Chestnut Dr
Van, TX 75790
|
1,755 sq. feet
|
- baths - beds |
show details | |

|
#48
S Pine St
Van, TX 75790
|
- sq. feet
|
- baths - beds |
show details | |

|
#49
E Kansas St
Van, TX 75790
|
1,787 sq. feet
|
- baths - beds |
show details | |

|
Check over 1 million property listings on Foreclosure.com!
|
browse all offers | |||

Latest news about housing in Brownsboro, TX collected exclusively by city-data.com from local newspapers, TV, and radio stations

 | If you needed a 4 or 5 bdr house... (17 replies) |
| Anyone know anything about Fruitvale, Texas? (26 replies) |
| The Vista community in Brownsboro (13 replies) |
| Best areas around Tyler, TX (5 replies) |
| Tyler area for interracial family? (10 replies) |
| Tyler versus Palestine for Retired In-laws? (7 replies) |
Median year apartment built: 2004
Household type by relationship:
Households: 1,523- Male householders: 212 (36 living alone), Female householders: 293 (54 living alone)
296 spouses (296 opposite-sex spouses), 5 unmarried partners, (5 opposite-sex unmarried partners), 511 children (457 natural, 34 adopted, 19 stepchildren), 43 grandchildren, 32 brothers or sisters, 3 parents, 0 foster children, 30 other relatives, 94 non-relatives
Size of family households: 102 2-persons, 89 3-persons, 142 4-persons, 17 5-persons, 40 6-persons.
Size of nonfamily households: 106 1-person, 17 2-persons.
243 married couples with children.
81 single-parent households (3 men, 78 women).
90.2% of residents of Brownsboro speak English at home.
9.2% of residents speak Spanish at home (49% speak English very well, 19% speak English well, 21% speak English not well, 11% don't speak English at all).
Foreign born population: 72 (4.7%)
(65.3% of them are naturalized citizens)
| Here: | 5.7 |
| State: | 6.3 |
| Here: | 5.1 |
| State: | 4.0 |

- Bedrooms in owner-occupied houses and condos in Brownsboro, Texas
- 0no bedroom
- 31 bedroom
- 522 bedrooms
- 1843 bedrooms
- 394 bedrooms
- 05+ bedrooms

- Bedrooms in renter-occupied apartments in Brownsboro, Texas
- 0no bedroom
- 141 bedroom
- 682 bedrooms
- 1483 bedrooms
- 134 bedrooms
- 05+ bedrooms

- Cars and other vehicles available in Brownsboro in owner-occupied houses/condos
- 5no vehicle
- 531 vehicle
- 1032 vehicles
- 983 vehicles
- 134 vehicles
- 65+ vehicles

- Cars and other vehicles available in Brownsboro in renter-occupied apartments
- 15no vehicle
- 1201 vehicle
- 412 vehicles
- 673 vehicles
- 04 vehicles
- 05+ vehicles

- Rooms in owner-occupied houses in Brownsboro, Texas
- 01 room
- 02 rooms
- 73 rooms
- 244 rooms
- 1235 rooms
- 516 rooms
- 347 rooms
- 248 rooms
- 159+ rooms

- Rooms in renter-occupied apartments in Brownsboro, Texas
- 01 room
- 32 rooms
- 343 rooms
- 454 rooms
- 945 rooms
- 676 rooms
- 07 rooms
- 08 rooms
- 09+ rooms


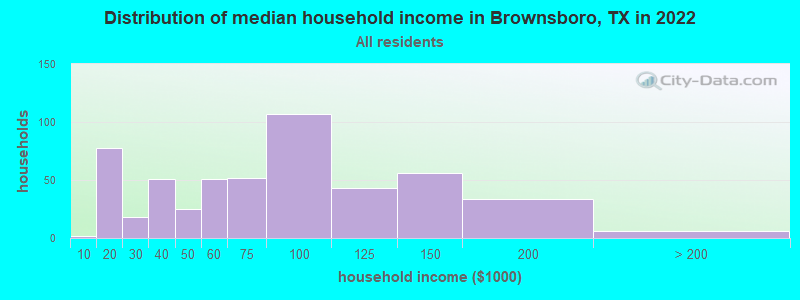
Brownsboro, TX household income distribution

- 2Less than $10,000
- 78$10,000 to $19,999
- 18$20,000 to $29,999
- 51$30,000 to $39,999
- 25$40,000 to $49,999
- 51$50,000 to $59,999
- 52$60,000 to $74,999
- 107$75,000 to $99,999
- 43$100,000 to $124,999
- 56$125,000 to $149,999
- 34$150,000 to $199,999
- 6$200,000 or more
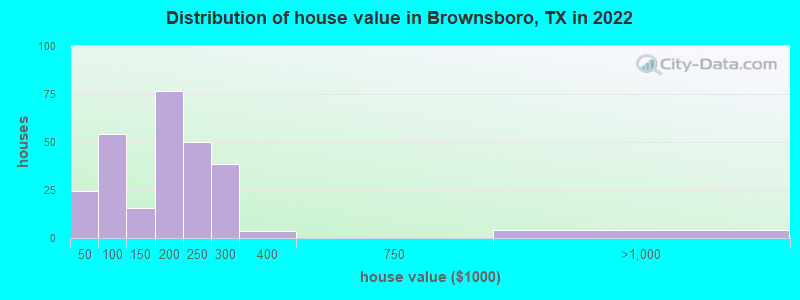
Home value of owner - occupied houses in 2022 in Brownsboro, TX
-
- 2Less than $10,000
- 3$30,000 to $34,999
- 2$35,000 to $39,999
- 16$40,000 to $49,999
- 9$50,000 to $59,999
- 16$60,000 to $69,999
- 2$70,000 to $79,999
- 2$80,000 to $89,999
- 6$90,000 to $99,999
- 10$100,000 to $124,999
- 5$125,000 to $149,999
- 25$150,000 to $174,999
- 51$175,000 to $199,999
- 50$200,000 to $249,999
- 38$250,000 to $299,999
- 3$300,000 to $399,999
- 4$750,000 to $999,999
Rent paid by renters in 2022 in Brownsboro, TX
-
- 5$450 to $499
- 19$500 to $549
- 20$550 to $599
- 10$650 to $699
- 7$700 to $749
- 10$750 to $799
- 44$900 to $999
- 78$1,000 to $1,249
- 12$1,250 to $1,499
- 15No cash rent


Percentage of workers working in this county: 47.9%
Number of people working at home: 42 (5.5% of all workers)
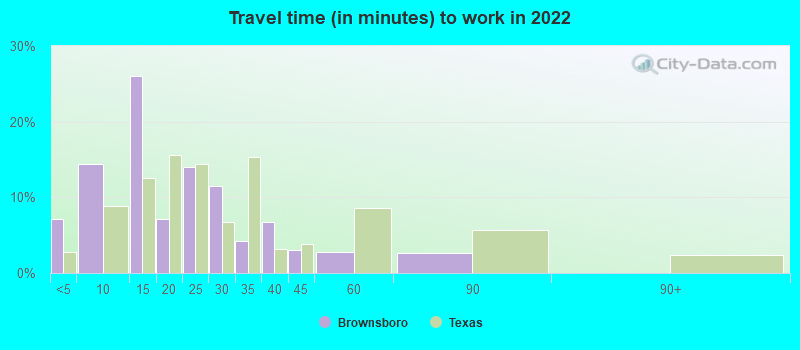
Travel time to work (commute)
- Less than 5 minutes: 89
- 5 to 9 minutes: 66
- 10 to 14 minutes: 51
- 15 to 19 minutes: 18
- 20 to 24 minutes: 112
- 25 to 29 minutes: 40
- 30 to 34 minutes: 138
- 35 to 39 minutes: 15
- 40 to 44 minutes: 68
- 45 to 59 minutes: 138
- 60 to 89 minutes: 10
- 90 or more minutes: 7
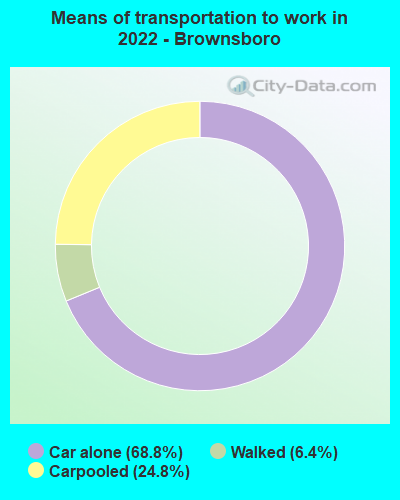
Means of transportation to work:
- Drove a car alone: 418 (64.2%)
- Carpooled: 157 (24.1%)
- Walked: 40 (6.1%)

- Unemployment by race in 2022
- Unemployment rate for White non-Hispanic residents
- 2.4%Males
- 1.2%Females
- Unemployment rate for Hispanic or Latino residents
- 12.8%Females

- Year of entry for the foreign-born population in Brownsboro, Texas
- 72010 or later
- 142000 to 2009
- 211990 to 1999
- 21980 to 1989
- 01970 to 1979
- 0Before 1970

First ancestries reported:
- German: 214 (23.4%)
- Irish: 203 (22.2%)
- American: 61 (6.7%)
- Italian: 48 (5.2%)
- Scottish: 47 (5.1%)
- English: 39 (4.3%)
- Norwegian: 9 (1.0%)
- Welsh: 8 (0.9%)
- Dutch: 2 (0.2%)
- Scotch-Irish: 1 (0.1%)
- Swedish: 1 (0.1%)
Most common places of birth for foreign-born residents (%):
| Brownsboro: | 88.3% (53) |
| Texas: | 48.4% (2,411,723) |
| Brownsboro: | 6.7% (4) |
| Texas: | 4.5% (224,455) |
Place of birth for U.S.-born residents:
- This state: 1,126
- Other state: 293
- Northeast: 20
- Midwest: 96
- South: 108
- West: 61
62.2% of Brownsboro residents lived in the same house 1 years ago.
Out of people who lived in different houses, 34.9% lived in this county.
Out of people who lived in different counties, 37.9% lived in Texas.
| Brownsboro: | 62.2% |
| State average: | 85.7% |
Education attainment for males 25 years and older:
- No schooling: 46
- Nursery to 4th grade: 0
- 5th and 6th grade: 7
- 7th and 8th grade: 0
- 9th grade: 5
- 10th grade: 3
- 11th grade: 0
- 12th grade, no diploma: 5
- High school graduate (or equivalency): 194
- Less than 1 year of college: 34
- Some college more than 1 year, no degree: 75
- Associate degree: 36
- Bachelor's degree: 47
- Master's degree: 16
- Professional school degree: 2
- Doctorate degree: 0

Education attainment for females 25 years and older:
- No schooling: 23
- Nursery to 4th grade: 8
- 5th and 6th grade: 0
- 7th and 8th grade: 0
- 9th grade: 7
- 10th grade: 0
- 11th grade: 22
- 12th grade, no diploma: 0
- High school graduate (or equivalency): 136
- Less than 1 year of college: 36
- Some college more than 1 year, no degree: 105
- Associate degree: 8
- Bachelor's degree: 38
- Master's degree: 11
- Professional school degree: 3
- Doctorate degree: 0

Housing units in structures:
- One, detached: 324
- One, attached: 49
- Two: 5
- 3 or 4: 44
- 10 to 19: 52
- 20 to 49: 19
- 50 or more: 3
- Mobile homes: 40
Median worth of mobile homes: $67,875
Housing units lacking complete kitchen facilities in 2022: 2.1%
House/condo owner moved in on average 7 years ago
Renter moved in on average 0 years ago

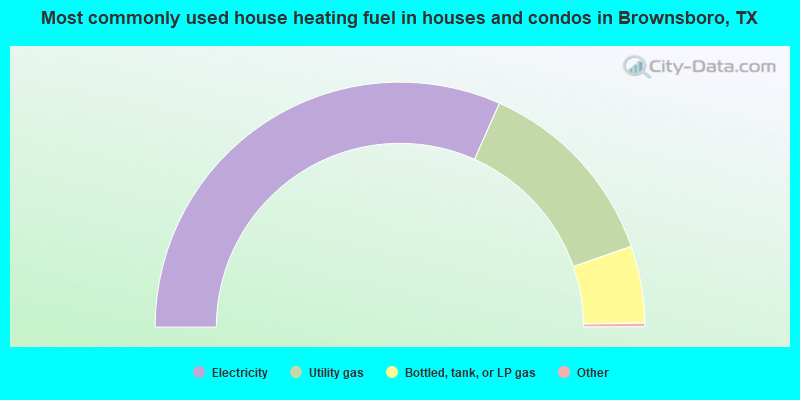
- 63.6%Electricity
- 26.1%Utility gas
- 10.2%Bottled, tank, or LP gas
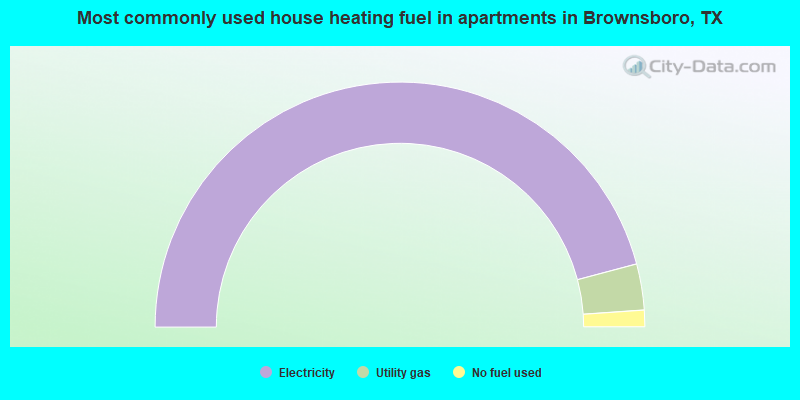
- 91.8%Electricity
- 6.1%Utility gas
- 2.2%No fuel used
Private vs. public school enrollment:
| Here: | 8.1% |
| Texas: | 8.8% |
| Here: | 1.5% |
| Texas: | 8.0% |
| Here: | 64.2% |
| Texas: | 16.2% |


