Housing density: 2,458 houses/condos per square mile
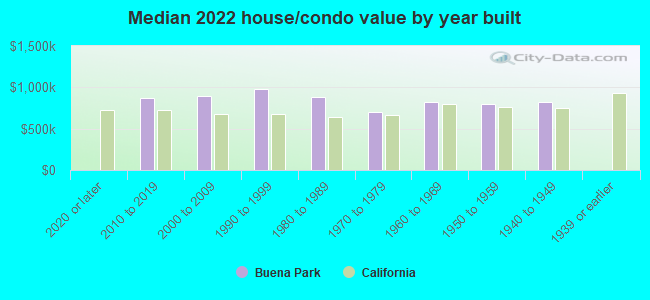
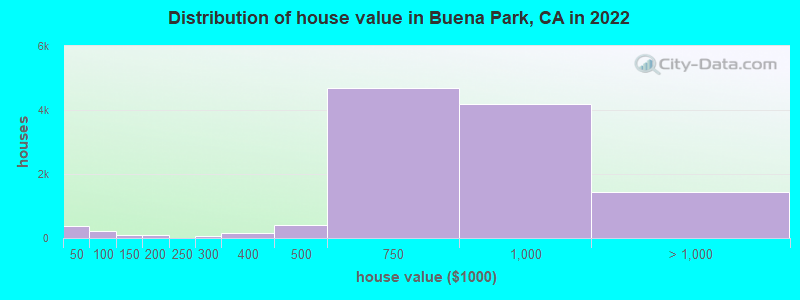
Median price asked for vacant for-sale houses and condos in 2022: $589,064.
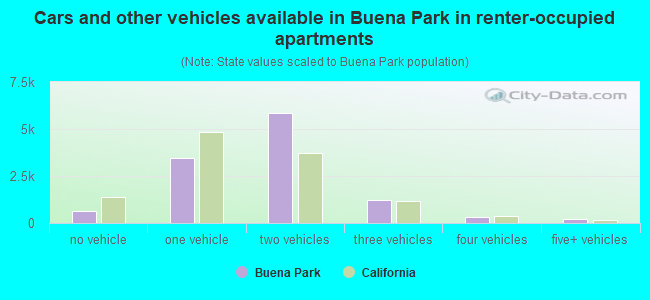
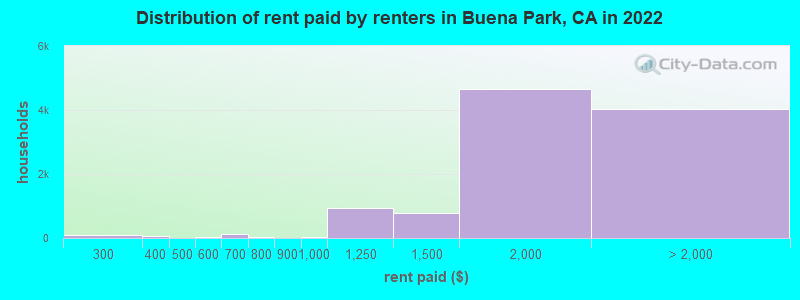
Median contract rent in 2022: $1,830 (lower quartile is $1,557, upper quartile is over $2,000)
Median rent asked for vacant for-rent units in 2022: $1,865
Median gross rent in Buena Park, CA in 2022: over $2,000
Housing units in Buena Park with a mortgage: 9,737 (1,089 second mortgage, 48 home equity loan, 1,041 both second mortgage and home equity loan) Houses without a mortgage: 126
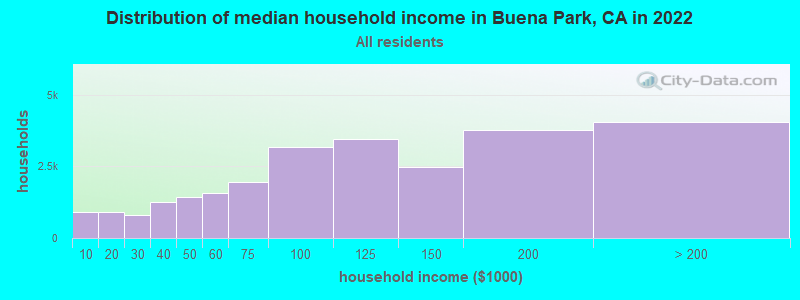
Median household income for houses/condos with a mortgage: $148,917
Median household income for apartments without a mortgage: $94,769
12,739 married couples with children.
2,466 single-parent households (598 men, 1,868 women).
47.0% of residents of Buena Park speak English at home.
24.6% of residents speak Spanish at home (64% speak English very well, 17% speak English well, 13% speak English not well, 5% don't speak English at all).
4.1% of residents speak other Indo-European language at home (60% speak English very well, 22% speak English well, 15% speak English not well, 2% don't speak English at all).
23.1% of residents speak Asian or Pacific Island language at home (53% speak English very well, 27% speak English well, 17% speak English not well, 3% don't speak English at all).
1.2% of residents speak other language at home (68% speak English very well, 10% speak English well, 22% speak English not well).
Foreign born population: 31,208 (37.9%)
(66.3% of them are naturalized citizens)
Percentage of workers working in this county: 68.2% Number of people working at home: 4,689 (11.1% of all workers)
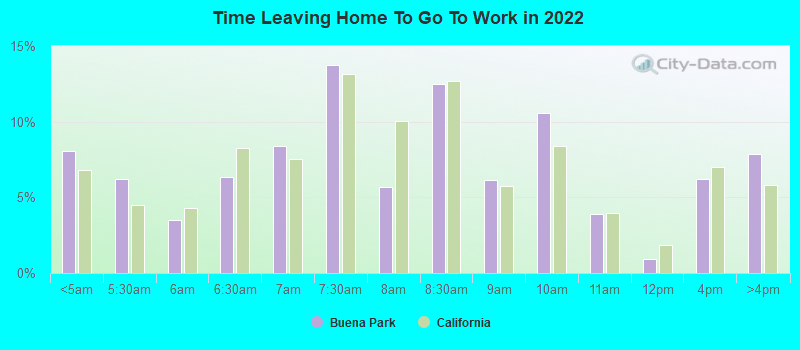
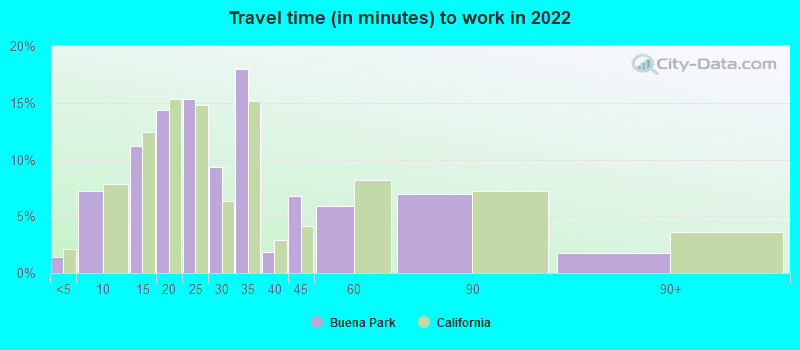
Travel time to work (commute)
Less than 5 minutes: 305
5 to 9 minutes: 2,932
10 to 14 minutes: 2,810
15 to 19 minutes: 5,508
20 to 24 minutes: 5,513
25 to 29 minutes: 1,622
30 to 34 minutes: 6,499
35 to 39 minutes: 1,065
40 to 44 minutes: 1,635
45 to 59 minutes: 3,070
60 to 89 minutes: 3,809
90 or more minutes: 827
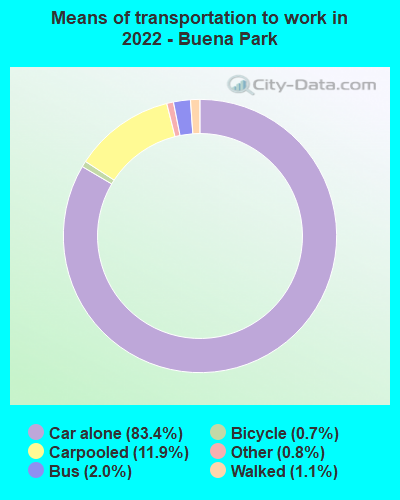
Means of transportation to work:
Drove a car alone: 25,949 (71.3%)
Carpooled: 3,999 (11.0%)
Bus: 572 (1.6%)
Subway or elevated rail: 10 (0.0%)
Long-distance train or commuter rail: 8 (0.0%)
Taxi: 289 (0.8%)
Bicycle: 219 (0.6%)
Walked: 343 (0.9%)
Worked at home: 4,689 (12.9%)
Unemployment by race in 2022
Unemployment rate for White non-Hispanic residents
2.9%Males
1.7%Females
Unemployment rate for Black residents
5.5%Males
3.6%Females
Unemployment rate for American Indian and Alaska Native residents
24.3%Males
5.9%Females
Unemployment rate for Asian residents
5.6%Males
4.0%Females
Unemployment rate for other race residents
4.3%Males
1.8%Females
Unemployment rate for two or more race residents
3.9%Males
5.8%Females
Unemployment rate for Hispanic or Latino residents
4.4%Males
3.3%Females
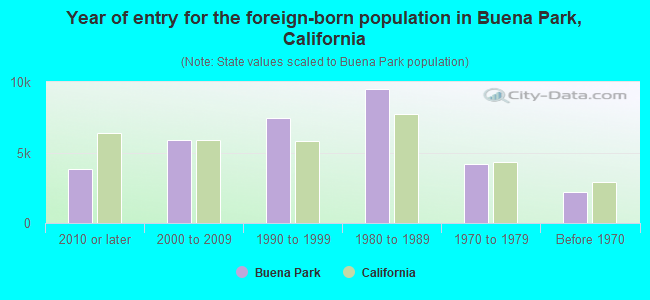
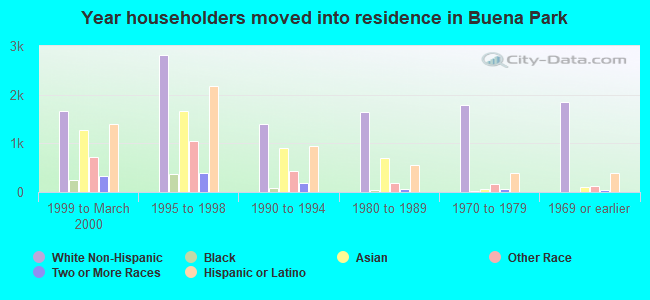
Year of entry for the foreign-born population in Buena Park, California
3,8642010 or later
5,8542000 to 2009
7,4391990 to 1999
9,5181980 to 1989
4,1701970 to 1979
2,164Before 1970
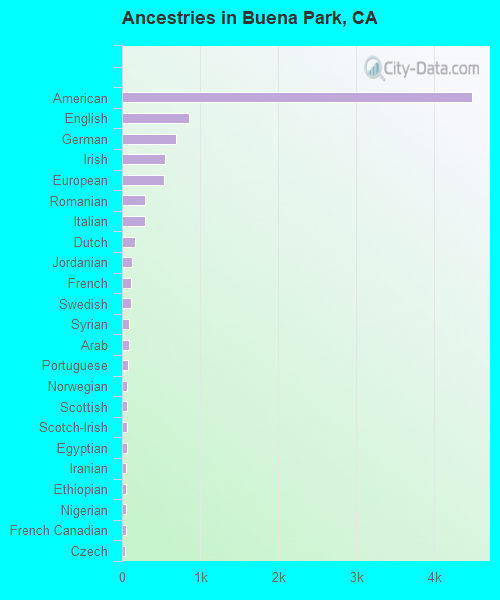
First ancestries reported:
American: 4,478 (8.7%)
English: 857 (1.7%)
German: 693 (1.3%)
Irish: 551 (1.1%)
European: 533 (1.0%)
Romanian: 300 (0.6%)
Italian: 292 (0.6%)
Dutch: 161 (0.3%)
Jordanian: 127 (0.2%)
French: 120 (0.2%)
Swedish: 116 (0.2%)
Syrian: 96 (0.2%)
Arab: 86 (0.2%)
Portuguese: 73 (0.1%)
Norwegian: 70 (0.1%)
Scottish: 65 (0.1%)
Scotch-Irish: 63 (0.1%)
Egyptian: 58 (0.1%)
Iranian: 53 (0.1%)
Ethiopian: 52 (0.1%)
Nigerian: 49 (0.09%)
French Canadian: 46 (0.09%)
Czech: 42 (0.08%)
Canadian: 39 (0.08%)
Moroccan: 38 (0.07%)
Polish: 38 (0.07%)
African: 32 (0.06%)
Greek: 30 (0.06%)
Palestinian: 30 (0.06%)
British: 19 (0.04%)
Russian: 19 (0.04%)
Brazilian: 15 (0.03%)
Northern European: 12 (0.02%)
Yugoslavian: 12 (0.02%)
Danish: 11 (0.02%)
Swiss: 11 (0.02%)
Jamaican: 11 (0.02%)
Finnish: 10 (0.02%)
Lithuanian: 10 (0.02%)
Belgian: 5 (0.01%)
Ghanaian: 5 (0.01%)
Lebanese: 4 (0.01%)
Most common places of birth for foreign-born residents (%):
Mexico
Buena Park:
26.8% (7,938)
California:
37.2% (3,881,193)
Korea
Buena Park:
22.1% (6,550)
California:
3.0% (315,248)
Philippines
Buena Park:
15.5% (4,591)
California:
7.8% (818,297)
India
Buena Park:
6.3% (1,877)
California:
5.2% (539,184)
Vietnam
Buena Park:
4.6% (1,354)
California:
4.9% (512,335)
Peru
Buena Park:
1.8% (532)
California:
0.7% (74,025)
Taiwan
Buena Park:
1.7% (501)
California:
1.7% (176,274)
Place of birth for U.S.-born residents:
This state: 42,981
Other state: 7,139
Northeast: 1,823
Midwest: 2,075
South: 2,201
West: 1,040
90.8% of Buena Park residents lived in the same house 1 years ago. Out of people who lived in different houses, 36.7% lived in this county. Out of people who lived in different counties, 81.0% lived in California.
Buena Park:
90.8%
State average:
88.9%
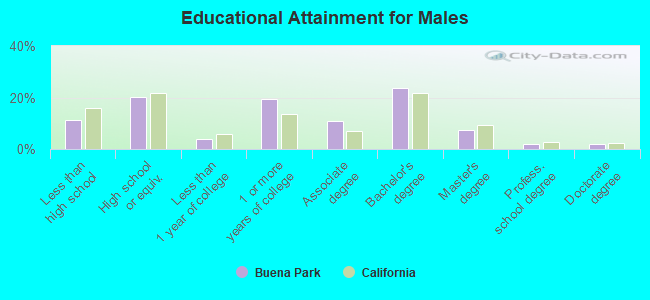
Education attainment for males 25 years and older:
No schooling: 650
Nursery to 4th grade: 225
5th and 6th grade: 458
7th and 8th grade: 307
9th grade: 279
10th grade: 361
11th grade: 438
12th grade, no diploma: 546
High school graduate (or equivalency): 5,839
Less than 1 year of college: 1,176
Some college more than 1 year, no degree: 5,631
Associate degree: 3,156
Bachelor's degree: 6,909
Master's degree: 2,112
Professional school degree: 571
Doctorate degree: 518
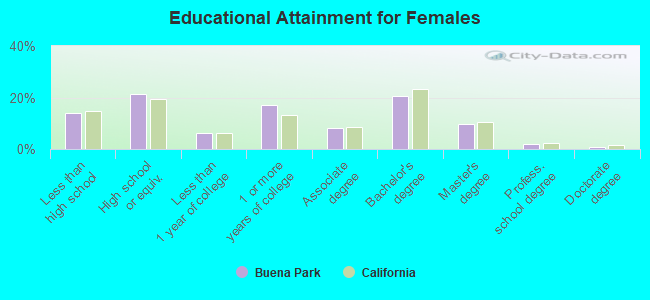
Education attainment for females 25 years and older:
No schooling: 855
Nursery to 4th grade: 112
5th and 6th grade: 692
7th and 8th grade: 299
9th grade: 336
10th grade: 340
11th grade: 567
12th grade, no diploma: 828
High school graduate (or equivalency): 6,122
Less than 1 year of college: 1,752
Some college more than 1 year, no degree: 4,947
Associate degree: 2,344
Bachelor's degree: 5,888
Master's degree: 2,815
Professional school degree: 542
Doctorate degree: 207
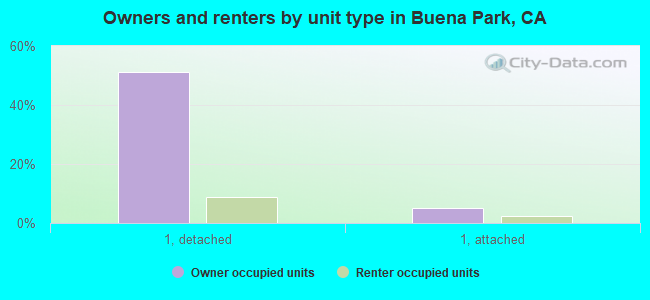
Housing units in structures:
One, detached: 14,566
One, attached: 2,481
Two: 180
3 or 4: 1,859
5 to 9: 1,721
10 to 19: 2,088
20 to 49: 1,461
50 or more: 1,374
Mobile homes: 259
Median worth of mobile homes: $50,400
Housing units lacking complete plumbing facilities in 2022: 0.5%
Housing units lacking complete kitchen facilities in 2022: 5.5%
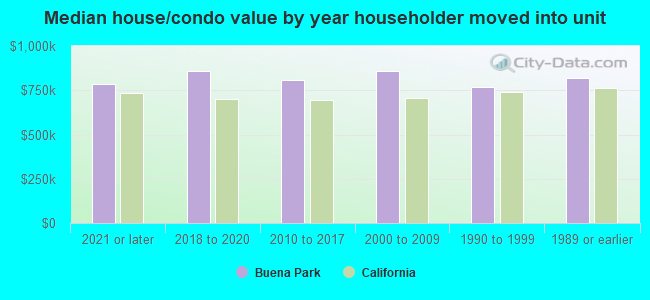
House/condo owner moved in on average 13 years ago