Burlington, IL (Illinois) Houses and Residents
| Burlington: | $291,589 |
| Illinois: | $251,600 |
Total population: 636 (Urban population: 0, Rural population: 461 (all nonfarm))
Houses: 205 (186 occupied: 126 owner occupied, 60 renter occupied)
| % of renters here: | 32% |
| State: | 33% |
Housing density: 579 houses/condos per square mile
Median price asked for vacant for-sale houses and condos in 2022 in this county: $350,134.
Median contract rent in 2022: $995 (lower quartile is $713, upper quartile is $1,443)
Median rent asked for vacant for-rent units in 2022: $938
Median gross rent in Burlington, IL in 2022: $1,163
Housing units in Burlington with a mortgage: 81 (5 second mortgage, 0 home equity loan, 1 both second mortgage and home equity loan)
Houses without a mortgage: 0
Median household income for houses/condos with a mortgage: $76,479
Median household income for apartments without a mortgage: $91,508
Median monthly housing costs: $1,432
Compare current foreclosures near Burlington, IL:
| Photo | Address | Area | Beds / Baths | Price | Details |
|---|---|---|---|---|---|

|
#1
Corron Rd
Elgin, IL 60124
|
3,352 sq. feet
|
3 baths 4 beds |
$709,000
|
show details |

|
#2
Leonard Ave
Dekalb, IL 60115
|
1,295 sq. feet
|
2 baths 3 beds |
$245,000
|
show details |

|
#3
W809 Bending Ln
Elgin, IL 60124
|
4,100 sq. feet
|
3 baths 4 beds |
$607,000
|
show details |

|
#4
Sara Ln
Marengo, IL 60152
|
3,202 sq. feet
|
2 baths 4 beds |
$425,000
|
show details |

|
#5
Page Ave
Elgin, IL 60120
|
- sq. feet
|
2 baths 3 beds |
$199,500
|
show details |

|
#6
Pine Ln
Carpentersville, IL 60110
|
2,188 sq. feet
|
3 baths 3 beds |
show details | |

|
#7
E Daisy Ave
Cortland, IL 60112
|
726 sq. feet
|
2 baths 1 beds |
show details | |

|
#8
Wayne St
Union, IL 60180
|
1,595 sq. feet
|
1 baths 3 beds |
show details | |

|
#9
Monroe St
Genoa, IL 60135
|
1,412 sq. feet
|
2 baths 3 beds |
show details | |

|
#10
Windridge Ct
Carpentersville, IL 60110
|
3,046 sq. feet
|
2 baths 4 beds |
show details |
| Photo | Address | Area | Beds / Baths | Price | Details |
|---|---|---|---|---|---|

|
#11
Woodlawn Ave
Saint Charles, IL 60174
|
1,427 sq. feet
|
2 baths 4 beds |
show details | |

|
#12
Lancaster St
Huntley, IL 60142
|
1,914 sq. feet
|
2 baths 3 beds |
show details | |

|
#13
Partridge Ct
Algonquin, IL 60102
|
1,400 sq. feet
|
2 baths 2 beds |
show details | |

|
#14
Cottonwood Dr
Elgin, IL 60123
|
1,751 sq. feet
|
3 baths 3 beds |
show details | |

|
#15
N Van Buren St
Dundee, IL 60118
|
2,356 sq. feet
|
2 baths 3 beds |
show details | |

|
#16
Cole Dr
South Elgin, IL 60177
|
3,499 sq. feet
|
3 baths 4 beds |
show details | |

|
#17
Westport Dr
Hampshire, IL 60140
|
3,018 sq. feet
|
3 baths 4 beds |
show details | |

|
#18
N202 Prairie Valley
Saint Charles, IL 60175
|
1,700 sq. feet
|
3 baths 4 beds |
show details | |

|
#19
Meadow View Dr
Saint Charles, IL 60175
|
3,560 sq. feet
|
2 baths 4 beds |
show details | |

|
#20
Edgewood Ave
Hampshire, IL 60140
|
1,359 sq. feet
|
1 baths 3 beds |
show details |
| Photo | Address | Area | Beds / Baths | Price | Details |
|---|---|---|---|---|---|

|
#21
N Dogwood St
Cortland, IL 60112
|
1,308 sq. feet
|
2 baths 3 beds |
show details | |

|
#22
Upland Road
Hampshire, IL 60140
|
- sq. feet
|
2 baths 3 beds |
show details | |

|
#23
Getty St
Elgin, IL 60120
|
1,280 sq. feet
|
3 baths 3 beds |
show details | |

|
#24
Fernwood Ln
Algonquin, IL 60102
|
5,776 sq. feet
|
5 baths 5 beds |
show details | |

|
#25
Collins Dr
Elburn, IL 60119
|
2,669 sq. feet
|
2 baths 4 beds |
show details | |

|
#26
Aster Ct
Lake In The Hills, IL 60156
|
2,049 sq. feet
|
2 baths 4 beds |
show details | |

|
#27
S Peace Rd
Sycamore, IL 60178
|
763 sq. feet
|
1 baths 2 beds |
show details | |

|
#28
Pond Gate Dr
Barrington, IL 60010
|
4,996 sq. feet
|
2 baths 4 beds |
show details | |

|
#29
Glenbrook Ct
Gilberts, IL 60136
|
2,895 sq. feet
|
2 baths 5 beds |
show details | |

|
#30
Chicago Ave
Crystal Lake, IL 60014
|
861 sq. feet
|
1 baths 2 beds |
show details |
| Photo | Address | Area | Beds / Baths | Price | Details |
|---|---|---|---|---|---|

|
#31
Ramsdell St
Huntley, IL 60142
|
3,197 sq. feet
|
3 baths 5 beds |
show details | |

|
#32
Camden Ct
Lake In The Hills, IL 60156
|
2,167 sq. feet
|
2 baths 4 beds |
show details | |

|
#33
Leland Ln
Huntley, IL 60142
|
3,912 sq. feet
|
2 baths 4 beds |
show details | |

|
#34
Waterbury Pl
Lake In The Hills, IL 60156
|
2,047 sq. feet
|
2 baths 3 beds |
show details | |

|
#35
Melbourne Ln
Lake In The Hills, IL 60156
|
1,883 sq. feet
|
2 baths 3 beds |
show details | |

|
#36
Hickory Dr
Carpentersville, IL 60110
|
920 sq. feet
|
- baths 3 beds |
show details | |

|
#37
Hunter Trl
Huntley, IL 60142
|
2,755 sq. feet
|
2 baths 5 beds |
show details | |

|
#38
Wakefield Ln
Huntley, IL 60142
|
1,507 sq. feet
|
2 baths 2 beds |
show details | |

|
#39
Oregon Trl
Huntley, IL 60142
|
1,900 sq. feet
|
2 baths 3 beds |
show details | |

|
#40
Evendale Rd
Huntley, IL 60142
|
1,917 sq. feet
|
3 baths 4 beds |
show details |
| Photo | Address | Area | Beds / Baths | Price | Details |
|---|---|---|---|---|---|

|
#41
Oak Ridge Rd
Marengo, IL 60152
|
2,850 sq. feet
|
2 baths 4 beds |
show details | |

|
#42
Pauline Ave
Crystal Lake, IL 60014
|
1,053 sq. feet
|
- baths 2 beds |
show details | |

|
#43
Evendale Rd
Huntley, IL 60142
|
2,496 sq. feet
|
2 baths 3 beds |
show details | |

|
#44
Aster Ct
Lake In The Hills, IL 60156
|
2,049 sq. feet
|
2 baths 4 beds |
show details | |

|
#45
Tuscany Dr
Algonquin, IL 60102
|
2,229 sq. feet
|
2 baths 4 beds |
show details | |

|
#46
Ann St
Elgin, IL 60120
|
- sq. feet
|
1 baths 3 beds |
show details | |

|
#47
Carlemont Dr
Crystal Lake, IL 60014
|
1,050 sq. feet
|
2 baths 2 beds |
show details | |

|
#48
Campton Crossin
Saint Charles, IL 60175
|
3,589 sq. feet
|
2 baths - beds |
show details | |

|
#49
Stickley Ln
Lake In The Hills, IL 60156
|
2,448 sq. feet
|
2 baths 3 beds |
show details | |

|
Check over 1 million property listings on Foreclosure.com!
|
browse all offers | |||

Latest news about housing in Burlington, IL collected exclusively by city-data.com from local newspapers, TV, and radio stations


Median year apartment built: 1968
Household type by relationship:
Households: 426- Male householders: 108 (35 living alone), Female householders: 75 (16 living alone)
86 spouses (86 opposite-sex spouses), 24 unmarried partners, (24 opposite-sex unmarried partners), 115 children (115 natural, 0 adopted, 0 stepchildren), 2 grandchildren, 0 brothers or sisters, 2 parents, 0 foster children, 0 other relatives, 8 non-relatives
Size of family households: 47 2-persons, 44 3-persons, 32 4-persons, 3 5-persons.
Size of nonfamily households: 53 1-person, 8 2-persons.
53 married couples with children.
44 single-parent households (16 men, 28 women).
94.6% of residents of Burlington speak English at home.
4.4% of residents speak Spanish at home (71% speak English very well, 29% speak English not well).
Foreign born population: 8 (1.9%)
(100.0% of them are naturalized citizens)
| Here: | 6.9 |
| State: | 6.4 |
| Here: | 4.3 |
| State: | 4.1 |

- Bedrooms in owner-occupied houses and condos in Burlington, Illinois
- 0no bedroom
- 01 bedroom
- 142 bedrooms
- 693 bedrooms
- 314 bedrooms
- 125+ bedrooms

- Bedrooms in renter-occupied apartments in Burlington, Illinois
- 0no bedroom
- 31 bedroom
- 342 bedrooms
- 143 bedrooms
- 54 bedrooms
- 45+ bedrooms

- Cars and other vehicles available in Burlington in owner-occupied houses/condos
- 4no vehicle
- 201 vehicle
- 702 vehicles
- 233 vehicles
- 94 vehicles
- 05+ vehicles

- Cars and other vehicles available in Burlington in renter-occupied apartments
- 4no vehicle
- 181 vehicle
- 222 vehicles
- 163 vehicles
- 04 vehicles
- 05+ vehicles

- Rooms in owner-occupied houses in Burlington, Illinois
- 01 room
- 02 rooms
- 03 rooms
- 44 rooms
- 155 rooms
- 286 rooms
- 317 rooms
- 238 rooms
- 249+ rooms

- Rooms in renter-occupied apartments in Burlington, Illinois
- 01 room
- 02 rooms
- 33 rooms
- 274 rooms
- 105 rooms
- 86 rooms
- 07 rooms
- 58 rooms
- 79+ rooms


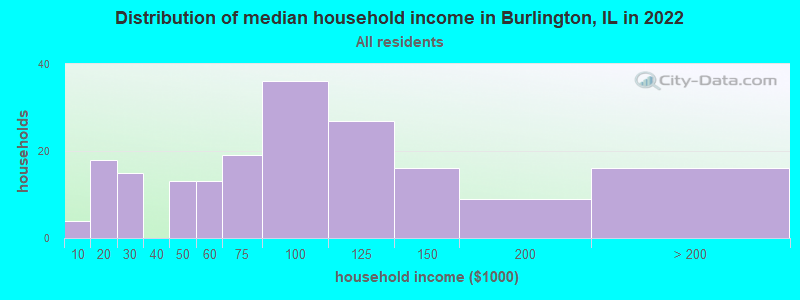
Burlington, IL household income distribution

- 4Less than $10,000
- 18$10,000 to $19,999
- 15$20,000 to $29,999
- 13$40,000 to $49,999
- 13$50,000 to $59,999
- 19$60,000 to $74,999
- 36$75,000 to $99,999
- 27$100,000 to $124,999
- 16$125,000 to $149,999
- 9$150,000 to $199,999
- 16$200,000 or more
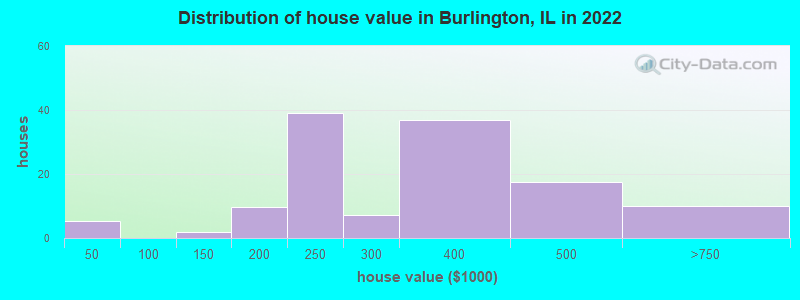
Home value of owner - occupied houses in 2022 in Burlington, IL
-
- 5Less than $10,000
- 1$125,000 to $149,999
- 6$150,000 to $174,999
- 2$175,000 to $199,999
- 39$200,000 to $249,999
- 7$250,000 to $299,999
- 36$300,000 to $399,999
- 17$400,000 to $499,999
- 10$500,000 to $749,999
Rent paid by renters in 2022 in Burlington, IL
-
- 4$600 to $649
- 4$650 to $699
- 10$700 to $749
- 8$800 to $899
- 2$900 to $999
- 7$1,000 to $1,249
- 6$1,250 to $1,499
- 11$1,500 to $1,999
- 8No cash rent


Percentage of workers working in this county: 72.8%
Number of people working at home: 28 (12.5% of all workers)
Travel time to work (commute)
- Less than 5 minutes: 3
- 5 to 9 minutes: 3
- 10 to 14 minutes: 20
- 15 to 19 minutes: 18
- 20 to 24 minutes: 29
- 25 to 29 minutes: 24
- 30 to 34 minutes: 20
- 35 to 39 minutes: 8
- 40 to 44 minutes: 32
- 45 to 59 minutes: 18
- 60 to 89 minutes: 16
- 90 or more minutes: 1
Means of transportation to work:
- Drove a car alone: 194 (84.7%)
- Carpooled: 17 (7.4%)
- Motorcycle: 1 (0.4%)
- Walked: 11 (4.8%)
- Other means: 4 (1.7%)
- Worked at home: 2 (0.9%)

- Unemployment by race in 2022
- Unemployment rate for White non-Hispanic residents
- 3.9%Males

- Year of entry for the foreign-born population in Burlington, Illinois
- 02010 or later
- 02000 to 2009
- 01990 to 1999
- 71980 to 1989
- 01970 to 1979
- 5Before 1970

First ancestries reported:
- German: 45 (28.6%)
- Irish: 23 (14.6%)
- American: 15 (9.5%)
- Polish: 14 (8.9%)
- English: 11 (7.0%)
- Norwegian: 8 (5.1%)
- Ukrainian: 4 (2.5%)
- Welsh: 4 (2.5%)
- European: 3 (1.9%)
- Swedish: 3 (1.9%)
Most common places of birth for foreign-born residents (%):
| Burlington: | 62.5% (5) |
| Illinois: | 34.7% (626,958) |
| Burlington: | 25.0% (2) |
| Illinois: | 0.0% (679) |
Place of birth for U.S.-born residents:
- This state: 371
- Other state: 43
- Northeast: 7
- Midwest: 29
- South: 6
- West: 0
91.8% of Burlington residents lived in the same house 1 years ago.
Out of people who lived in different houses, 34.0% lived in this county.
Out of people who lived in different counties, 53.8% lived in Illinois.
| Burlington: | 91.8% |
| State average: | 88.3% |
Education attainment for males 25 years and older:
- No schooling: 0
- Nursery to 4th grade: 0
- 5th and 6th grade: 0
- 7th and 8th grade: 4
- 9th grade: 0
- 10th grade: 0
- 11th grade: 0
- 12th grade, no diploma: 2
- High school graduate (or equivalency): 51
- Less than 1 year of college: 11
- Some college more than 1 year, no degree: 27
- Associate degree: 32
- Bachelor's degree: 32
- Master's degree: 3
- Professional school degree: 3
- Doctorate degree: 0

Education attainment for females 25 years and older:
- No schooling: 0
- Nursery to 4th grade: 0
- 5th and 6th grade: 0
- 7th and 8th grade: 6
- 9th grade: 0
- 10th grade: 0
- 11th grade: 4
- 12th grade, no diploma: 0
- High school graduate (or equivalency): 29
- Less than 1 year of college: 17
- Some college more than 1 year, no degree: 37
- Associate degree: 5
- Bachelor's degree: 30
- Master's degree: 0
- Professional school degree: 4
- Doctorate degree: 0


Housing units in structures:
- One, detached: 155
- One, attached: 17
- Two: 3
- 3 or 4: 6
- 5 to 9: 23
Housing units lacking complete kitchen facilities in 2022: 3.9%
House/condo owner moved in on average 11 years ago
Renter moved in on average 5 years ago

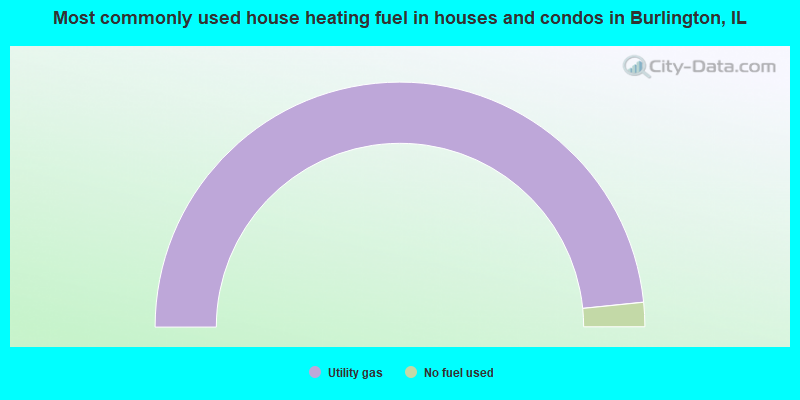
- 96.8%Utility gas
- 3.2%No fuel used
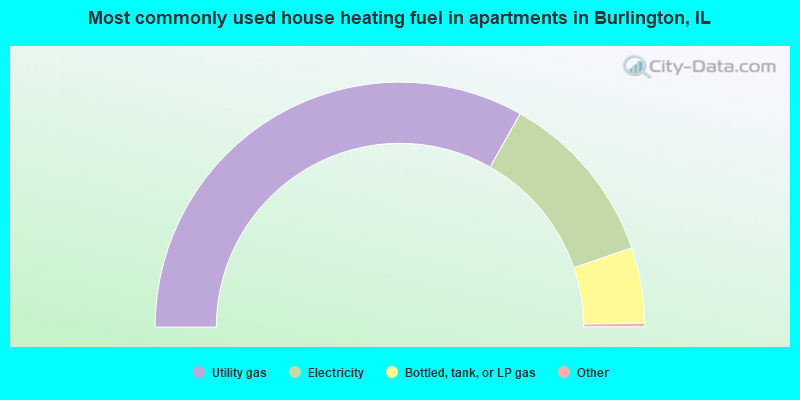
- 66.7%Utility gas
- 23.3%Electricity
- 10.0%Bottled, tank, or LP gas
Private vs. public school enrollment:
| Here: | 0.0% |
| Illinois: | 13.3% |
| Here: | 0.0% |
| Illinois: | 9.9% |
| Here: | 27.3% |
| Illinois: | 27.4% |


