Calcium, NY (New York) Houses and Residents
| Calcium: | $219,610 |
| New York: | $400,400 |
Mean price in 2022:
Detached houses: $220,199
Here: $220,199 State: $476,719 In 2-unit structures: $95,569
Here: $95,569 State: $713,077 Mobile homes: $62,555
Here: $62,555 State: $88,925
Total population: 3,491 (Urban population: 2,452 (all inside urban clusters), Rural population: 721 (all nonfarm))
Houses: 1,976 (1,737 occupied: 132 owner occupied, 1,624 renter occupied)
| % of renters here: | 92% |
| State: | 46% |
Housing density: 354 houses/condos per square mile
Median price asked for vacant for-sale houses and condos in 2022 in this county: $102,223.
Median contract rent in 2022: $1,193 (lower quartile is $974, upper quartile is $1,206)
Median rent asked for vacant for-rent units in 2022: $1,640
Median gross rent in Calcium, NY in 2022: $1,220
Housing units in Calcium with a mortgage: 42 (0 second mortgage, 0 home equity loan, 0 both second mortgage and home equity loan)
Houses without a mortgage: 0
Compare current foreclosures near Calcium, NY:
| Photo | Address | Area | Beds / Baths | Price | Details |
|---|---|---|---|---|---|

|
#1
Nys Route, # 342
Calcium, NY 13616
|
- sq. feet
|
- baths - beds |
show details | |

|
#2
Us Route 11, Lot 73
Calcium, NY 13616
|
- sq. feet
|
- baths - beds |
show details | |

|
#3
Nys Rt 12f
Dexter, NY 13634
|
1,763 sq. feet
|
2 baths 3 beds |
$225,000
|
show details |

|
#4
Andrews Rd
Black River, NY 13612
|
1,848 sq. feet
|
2 baths 2 beds |
$100,000
|
show details |

|
#5
State Pl
Watertown, NY 13601
|
1,608 sq. feet
|
1 baths 4 beds |
$108,900
|
show details |

|
#6
State St
Watertown, NY 13601
|
2,272 sq. feet
|
1 baths 4 beds |
show details | |

|
#7
Davidson St
Watertown, NY 13601
|
1,664 sq. feet
|
2 baths 3 beds |
show details | |

|
#8
Hunt St
Watertown, NY 13601
|
744 sq. feet
|
1 baths 3 beds |
show details | |

|
#9
W Hoard St
Watertown, NY 13601
|
1,208 sq. feet
|
1 baths 3 beds |
show details | |

|
#10
Superior St
Watertown, NY 13601
|
1,960 sq. feet
|
1 baths 3 beds |
show details |
| Photo | Address | Area | Beds / Baths | Price | Details |
|---|---|---|---|---|---|

|
#11
St Lawrence Ave E
Brownville, NY 13615
|
2,723 sq. feet
|
2 baths 6 beds |
show details | |

|
#12
Tilden St
Watertown, NY 13601
|
1,416 sq. feet
|
1 baths 3 beds |
show details | |

|
#13
Us Route 11
Watertown, NY 13601
|
2,520 sq. feet
|
2 baths 3 beds |
show details | |

|
#14
Deer River Rd
Copenhagen, NY 13626
|
1,365 sq. feet
|
1 baths 2 beds |
show details | |

|
#15
County Rte 25
Antwerp, NY 13608
|
1,332 sq. feet
|
1 baths 3 beds |
show details | |

|
#16
Eddy Rd
Carthage, NY 13619
|
1,140 sq. feet
|
1 baths 2 beds |
show details | |

|
#17
1st St
Carthage, NY 13619
|
1,020 sq. feet
|
1 baths 2 beds |
show details | |

|
#18
Main St
Watertown, NY 13601
|
1,546 sq. feet
|
1 baths 4 beds |
show details | |

|
#19
West St
Carthage, NY 13619
|
2,341 sq. feet
|
3 baths 4 beds |
show details | |

|
#20
Gardner Rd
Rodman, NY 13682
|
1,344 sq. feet
|
2 baths 3 beds |
show details |
| Photo | Address | Area | Beds / Baths | Price | Details |
|---|---|---|---|---|---|

|
#21
Bishop St
Watertown, NY 13601
|
2,284 sq. feet
|
2 baths 4 beds |
show details | |

|
#22
Broadway Ave W
Watertown, NY 13601
|
3,021 sq. feet
|
3 baths 7 beds |
show details | |

|
#23
County Route 76
Adams Center, NY 13606
|
2,128 sq. feet
|
2 baths 3 beds |
show details | |

|
#24
County Route 63
Watertown, NY 13601
|
1,614 sq. feet
|
1 baths 3 beds |
show details | |

|
#25
County Route 155
Watertown, NY 13601
|
1,196 sq. feet
|
2 baths 3 beds |
show details | |

|
#26
Staie Rd
Carthage, NY 13619
|
1,152 sq. feet
|
1 baths 3 beds |
show details | |

|
#27
State Route 26
Theresa, NY 13691
|
2,008 sq. feet
|
1 baths 2 beds |
show details | |

|
#28
Keyser Rd
Evans Mills, NY 13637
|
1,664 sq. feet
|
2 baths 3 beds |
show details | |

|
#29
Winslow St
Watertown, NY 13601
|
1,958 sq. feet
|
2 baths 4 beds |
show details | |

|
#30
N Hamilton St
Watertown, NY 13601
|
1,572 sq. feet
|
1 baths 3 beds |
show details |
| Photo | Address | Area | Beds / Baths | Price | Details |
|---|---|---|---|---|---|

|
#31
Burdick St
Watertown, NY 13601
|
774 sq. feet
|
1 baths 2 beds |
show details | |

|
#32
State Route 283
Watertown, NY 13601
|
2,542 sq. feet
|
2 baths 4 beds |
show details | |

|
#33
Hazelhurst Ave
Watertown, NY 13601
|
1,548 sq. feet
|
1 baths 3 beds |
show details | |

|
#34
Hunt St
Watertown, NY 13601
|
1,000 sq. feet
|
1 baths 3 beds |
show details | |

|
#35
Mustard Rd
Watertown, NY 13601
|
960 sq. feet
|
1 baths 3 beds |
show details | |

|
#36
Ambrose Dr
Black River, NY 13612
|
1,788 sq. feet
|
2 baths 3 beds |
show details | |

|
#37
Gill St
Watertown, NY 13601
|
1,164 sq. feet
|
1 baths 2 beds |
show details | |

|
#38
Shepard St
Watertown, NY 13601
|
1,240 sq. feet
|
1 baths 1 beds |
show details | |

|
#39
County Route 25
Antwerp, NY 13608
|
1,104 sq. feet
|
1 baths 2 beds |
show details | |

|
#40
Burchard St
Watertown, NY 13601
|
1,668 sq. feet
|
2 baths 3 beds |
show details |
| Photo | Address | Area | Beds / Baths | Price | Details |
|---|---|---|---|---|---|

|
#41
Cemetery Rd
Felts Mills, NY 13638
|
720 sq. feet
|
- baths 2 beds |
show details | |

|
#42
Boyd Rd
Carthage, NY 13619
|
560 sq. feet
|
- baths 3 beds |
show details | |

|
#43
Stone St
Watertown, NY 13601
|
- sq. feet
|
- baths - beds |
show details | |

|
#44
Lafave Rd
Watertown, NY 13601
|
- sq. feet
|
- baths - beds |
show details | |

|
#45
Riverside Ave
Theresa, NY 13691
|
- sq. feet
|
- baths - beds |
show details | |

|
#46
Emjay Way
Carthage, NY 13619
|
- sq. feet
|
- baths - beds |
show details | |

|
#47
State Route 283 Lot 19
Black River, NY 13612
|
- sq. feet
|
- baths - beds |
show details | |

|
#48
N Harbor Rd
Adams Center, NY 13606
|
- sq. feet
|
- baths - beds |
show details | |

|
#49
Us Route 11
Adams Center, NY 13606
|
- sq. feet
|
- baths - beds |
show details | |

|
Check over 1 million property listings on Foreclosure.com!
|
browse all offers | |||

Latest news about housing in Calcium, NY collected exclusively by city-data.com from local newspapers, TV, and radio stations

 | Rental communities or condo communties Upstate NY (58 replies) |
| Good neighborhoods in Watertown NY?? (45 replies) |
| Move back, or stay away? (70 replies) |
| Whole House Filtration System for Well Water (Washingtonville, NY Area) (3 replies) |
| smaller Upstate NY cities and towns/African American communities (5948 replies) |
| Relocating to Watertown/Sackets Harbor (23 replies) |

Median year apartment built: 1986
Household type by relationship:
Households: 3,597- Male householders: 1,015 (289 living alone), Female householders: 702 (216 living alone)
756 spouses (756 opposite-sex spouses), 135 unmarried partners, (135 opposite-sex unmarried partners), 545 children (545 natural, 0 adopted, 0 stepchildren), 0 grandchildren, 0 brothers or sisters, 0 parents, 0 foster children, 126 other relatives, 315 non-relatives
Size of family households: 416 2-persons, 355 3-persons, 81 4-persons, 10 5-persons.
Size of nonfamily households: 570 1-person, 213 2-persons, 6 3-persons, 23 4-persons.
317 married couples with children.
231 single-parent households (91 men, 140 women).
71.5% of residents of Calcium speak English at home.
13.8% of residents speak Spanish at home (100% speak English very well).
3.8% of residents speak other Indo-European language at home (100% speak English well).
1.9% of residents speak Asian or Pacific Island language at home (2% speak English very well, 98% speak English well).
8.3% of residents speak other language at home (100% speak English very well).
Foreign born population: 622 (17.3%)
(81.2% of them are naturalized citizens)
| Here: | 6.8 |
| State: | 6.3 |
| Here: | 3.9 |
| State: | 3.8 |

- Bedrooms in owner-occupied houses and condos in Calcium, New York
- 0no bedroom
- 01 bedroom
- 642 bedrooms
- 543 bedrooms
- 144 bedrooms
- 05+ bedrooms

- Bedrooms in renter-occupied apartments in Calcium, New York
- 215no bedroom
- 161 bedroom
- 1,0022 bedrooms
- 2463 bedrooms
- 1454 bedrooms
- 05+ bedrooms

- Cars and other vehicles available in Calcium in owner-occupied houses/condos
- 0no vehicle
- 621 vehicle
- 442 vehicles
- 263 vehicles
- 04 vehicles
- 05+ vehicles

- Cars and other vehicles available in Calcium in renter-occupied apartments
- 159no vehicle
- 7931 vehicle
- 6072 vehicles
- 653 vehicles
- 04 vehicles
- 05+ vehicles

- Rooms in owner-occupied houses in Calcium, New York
- 01 room
- 02 rooms
- 03 rooms
- 04 rooms
- 05 rooms
- 436 rooms
- 567 rooms
- 198 rooms
- 149+ rooms

- Rooms in renter-occupied apartments in Calcium, New York
- 01 room
- 2322 rooms
- 4093 rooms
- 4774 rooms
- 3195 rooms
- 556 rooms
- 917 rooms
- 428 rooms
- 09+ rooms


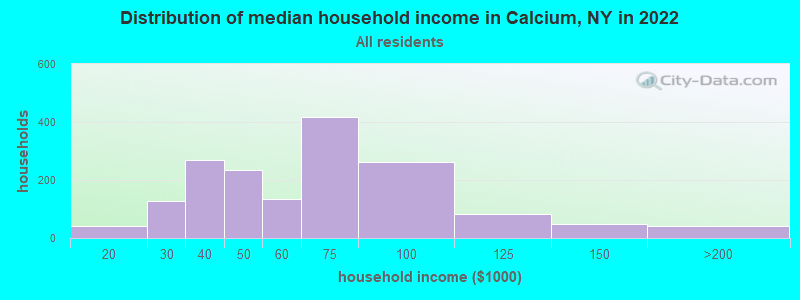
Calcium, NY household income distribution

- 40$10,000 to $19,999
- 129$20,000 to $29,999
- 268$30,000 to $39,999
- 233$40,000 to $49,999
- 135$50,000 to $59,999
- 418$60,000 to $74,999
- 261$75,000 to $99,999
- 83$100,000 to $124,999
- 50$125,000 to $149,999
- 41$150,000 to $199,999
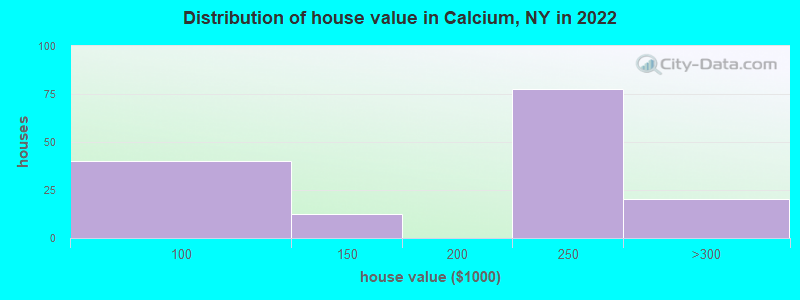
Home value of owner - occupied houses in 2022 in Calcium, NY
-
- 25$50,000 to $59,999
- 6$80,000 to $89,999
- 7$90,000 to $99,999
- 12$100,000 to $124,999
- 77$200,000 to $249,999
- 20$250,000 to $299,999
Rent paid by renters in 2022 in Calcium, NY
-
- 24Less than $100
- 14$600 to $649
- 80$750 to $799
- 145$900 to $999
- 1,322$1,000 to $1,249
- 197$1,250 to $1,499
- 105$1,500 to $1,999
- 16No cash rent


Percentage of workers working in this county: 90.2%
Number of people working at home: 6 (0.3% of all workers)
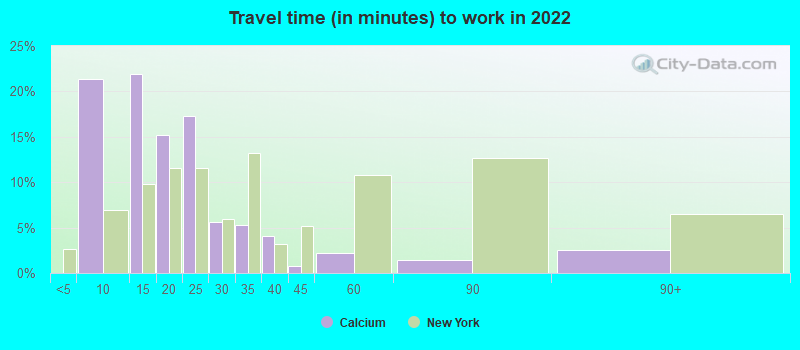
Travel time to work (commute)
- Less than 5 minutes: 259
- 5 to 9 minutes: 390
- 10 to 14 minutes: 437
- 15 to 19 minutes: 823
- 20 to 24 minutes: 206
- 25 to 29 minutes: 75
- 30 to 34 minutes: 55
- 35 to 39 minutes: 0
- 40 to 44 minutes: 114
- 45 to 59 minutes: 0
- 60 to 89 minutes: 0
- 90 or more minutes: 60
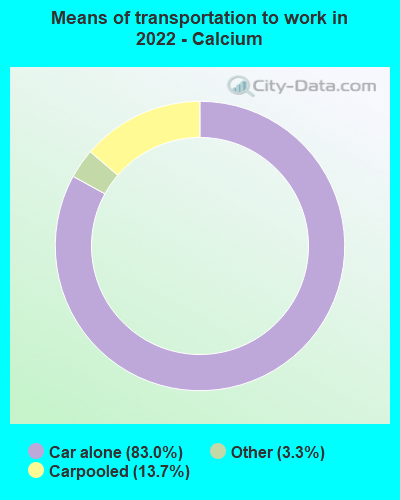
Means of transportation to work:
- Drove a car alone: 507 (80.1%)
- Carpooled: 88 (13.9%)
- Taxi: 25 (3.9%)
- Worked at home: 6 (0.9%)

- Unemployment by race in 2022
- Unemployment rate for White non-Hispanic residents
- 10.3%Males
- 2.5%Females
- Unemployment rate for two or more race residents
- 1.5%Females
- Unemployment rate for Hispanic or Latino residents
- 9.5%Females

- Year of entry for the foreign-born population in Calcium, New York
- 4652010 or later
- 632000 to 2009
- 171990 to 1999
- 521980 to 1989
- 271970 to 1979
- 9Before 1970

First ancestries reported:
- African: 241 (17.5%)
- Jamaican: 111 (8.1%)
- Scotch-Irish: 91 (6.6%)
- English: 60 (4.4%)
- Irish: 41 (3.0%)
- Hungarian: 32 (2.3%)
- American: 27 (2.0%)
- Trinidadian and Tobagonian: 26 (1.9%)
- Italian: 16 (1.2%)
Most common places of birth for foreign-born residents (%):
| Calcium: | 31.4% (161) |
| New York: | 0.2% (7,595) |
| Calcium: | 26.3% (135) |
| New York: | 0.9% (39,058) |
| Calcium: | 22.8% (117) |
| New York: | 5.0% (227,557) |
| Calcium: | 12.5% (64) |
| New York: | 0.4% (16,179) |
| Calcium: | 6.0% (31) |
| New York: | 4.8% (214,559) |
| Calcium: | 4.9% (25) |
| New York: | 2.0% (91,428) |
| Calcium: | 3.7% (19) |
| New York: | 11.1% (501,040) |
Place of birth for U.S.-born residents:
- This state: 1,224
- Other state: 1,744
- Northeast: 335
- Midwest: 203
- South: 831
- West: 388
54.4% of Calcium residents lived in the same house 1 years ago.
Out of people who lived in different houses, 30.2% lived in this county.
Out of people who lived in different counties, 11.4% lived in New York.
| Calcium: | 54.4% |
| State average: | 89.6% |
Education attainment for males 25 years and older:
- No schooling: 0
- Nursery to 4th grade: 0
- 5th and 6th grade: 0
- 7th and 8th grade: 0
- 9th grade: 0
- 10th grade: 0
- 11th grade: 0
- 12th grade, no diploma: 0
- High school graduate (or equivalency): 332
- Less than 1 year of college: 117
- Some college more than 1 year, no degree: 200
- Associate degree: 262
- Bachelor's degree: 207
- Master's degree: 39
- Professional school degree: 36
- Doctorate degree: 0

Education attainment for females 25 years and older:
- No schooling: 8
- Nursery to 4th grade: 0
- 5th and 6th grade: 0
- 7th and 8th grade: 0
- 9th grade: 0
- 10th grade: 0
- 11th grade: 0
- 12th grade, no diploma: 0
- High school graduate (or equivalency): 189
- Less than 1 year of college: 49
- Some college more than 1 year, no degree: 0
- Associate degree: 72
- Bachelor's degree: 271
- Master's degree: 67
- Professional school degree: 0
- Doctorate degree: 0


Housing units in structures:
- One, detached: 126
- One, attached: 462
- Two: 264
- 3 or 4: 406
- 5 to 9: 262
- 10 to 19: 120
- 50 or more: 204
- Mobile homes: 129

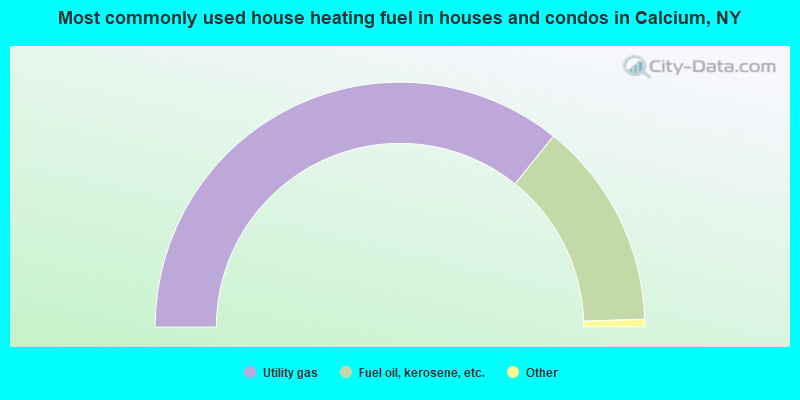
- 72.3%Utility gas
- 27.7%Fuel oil, kerosene, etc.
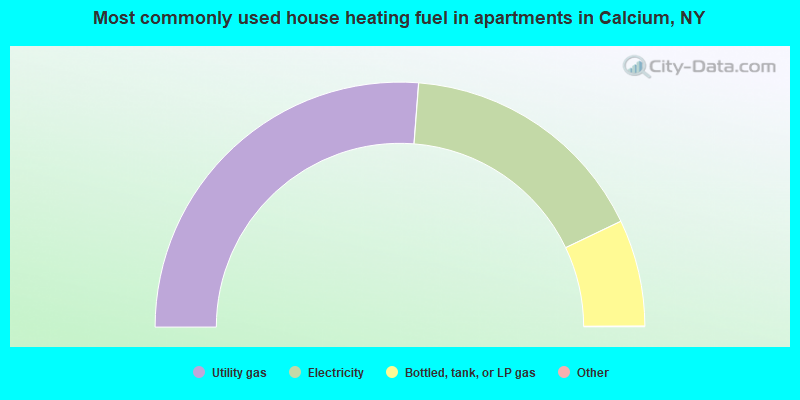
- 52.5%Utility gas
- 33.4%Electricity
- 14.1%Bottled, tank, or LP gas
Private vs. public school enrollment:
| Here: | 10.7% |
| New York: | 15.6% |
| Here: | 0.0% |
| New York: | 15.0% |
| Here: | 34.6% |
| New York: | 39.2% |


