Cambridge, MD (Maryland) Houses and Residents
| Cambridge: | $233,524 |
| Maryland: | $398,100 |
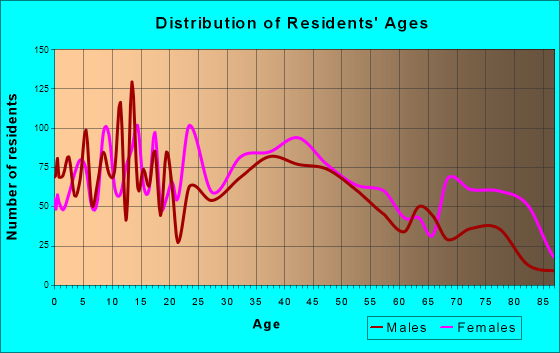
Total population: 12,569 (Urban population: 10,373 (all inside urban clusters), Rural population: 411 (all nonfarm))
Houses: 6,589 (5,372 occupied: 2,406 owner occupied, 3,040 renter occupied)
| % of renters here: | 56% |
| State: | 32% |
Housing density: 980 houses/condos per square mile
Median price asked for vacant for-sale houses and condos in 2022: $256,175.
Median contract rent in 2022: $745 (lower quartile is $479, upper quartile is $940)
Median rent asked for vacant for-rent units in 2022: $902
Median gross rent in Cambridge, MD in 2022: $927
Housing units in Cambridge with a mortgage: 1,339 (191 second mortgage, 0 home equity loan, 149 both second mortgage and home equity loan)
Houses without a mortgage: 112
Median household income for houses/condos with a mortgage: $93,111
Median household income for apartments without a mortgage: $52,883
Median monthly housing costs: $926
Compare current foreclosures in Cambridge, MD:
| Photo | Address | Area | Beds / Baths | Price | Details |
|---|---|---|---|---|---|

|
#1
Race St
Cambridge, MD 21613
|
1,495 sq. feet
|
2 baths - beds |
show details | |

|
#2
Central Ave
Cambridge, MD 21613
|
948 sq. feet
|
1 baths - beds |
show details | |

|
#3
Center St
Cambridge, MD 21613
|
576 sq. feet
|
1 baths - beds |
show details | |

|
#4
Osprey Cir
Cambridge, MD 21613
|
2,198 sq. feet
|
2 baths - beds |
show details | |

|
#5
Dorchester Ave
Cambridge, MD 21613
|
1,852 sq. feet
|
2 baths - beds |
show details | |

|
#6
Maryland Ave
Cambridge, MD 21613
|
1,463 sq. feet
|
1 baths - beds |
show details | |

|
#7
W End Ave
Cambridge, MD 21613
|
1,326 sq. feet
|
1 baths - beds |
show details | |

|
#8
Rainbow Ave
Cambridge, MD 21613
|
1,800 sq. feet
|
2 baths - beds |
show details | |

|
#9
William St
Cambridge, MD 21613
|
2,256 sq. feet
|
2 baths - beds |
show details | |

|
#10
Magnolia Trl
Cambridge, MD 21613
|
1,410 sq. feet
|
2 baths - beds |
show details |
| Photo | Address | Area | Beds / Baths | Price | Details |
|---|---|---|---|---|---|

|
#11
Robbins St
Cambridge, MD 21613
|
1,248 sq. feet
|
1 baths - beds |
show details | |

|
#12
Eagles Nest Way
Cambridge, MD 21613
|
2,535 sq. feet
|
2 baths - beds |
show details | |

|
#13
Leonards Ln
Cambridge, MD 21613
|
768 sq. feet
|
1 baths - beds |
show details | |

|
#14
Caribbean Ave
Cambridge, MD 21613
|
3,023 sq. feet
|
2 baths - beds |
show details | |

|
#15
Appleby School Rd
Cambridge, MD 21613
|
2,152 sq. feet
|
2 baths - beds |
show details | |

|
#16
High St
Cambridge, MD 21613
|
1,232 sq. feet
|
1 baths - beds |
show details | |

|
#17
Wood Duck Dr
Cambridge, MD 21613
|
2,420 sq. feet
|
2 baths - beds |
show details | |

|
#18
Drawbridge Rd
Cambridge, MD 21613
|
1,008 sq. feet
|
1 baths - beds |
show details | |

|
#19
Stone Boundary Rd
Cambridge, MD 21613
|
1,590 sq. feet
|
1 baths - beds |
show details | |

|
#20
Bonnie Brook Rd
Cambridge, MD 21613
|
1,040 sq. feet
|
1 baths - beds |
show details |
| Photo | Address | Area | Beds / Baths | Price | Details |
|---|---|---|---|---|---|

|
#21
Wood Duck Dr
Cambridge, MD 21613
|
- sq. feet
|
- baths - beds |
show details | |

|
#22
Old Route 50
Cambridge, MD 21613
|
- sq. feet
|
- baths - beds |
show details | |

|
#23
Cambridge Beltway
Cambridge, MD 21613
|
- sq. feet
|
- baths - beds |
show details | |

|
#24
Woods Rd Apt 4119
Cambridge, MD 21613
|
- sq. feet
|
- baths - beds |
show details | |

|
#25
Greenwood Ave
Cambridge, MD 21613
|
- sq. feet
|
- baths - beds |
show details | |

|
#26
Pungy Path
Cambridge, MD 21613
|
- sq. feet
|
- baths - beds |
show details | |

|
#27
Mariners Way
Cambridge, MD 21613
|
- sq. feet
|
- baths - beds |
show details | |

|
#28
Chateau Rd
Cambridge, MD 21613
|
- sq. feet
|
- baths - beds |
show details | |

|
#29
Night Heron Ct
Cambridge, MD 21613
|
- sq. feet
|
- baths - beds |
show details | |

|
#30
Bonnie Brook Rd
Cambridge, MD 21613
|
- sq. feet
|
- baths - beds |
show details |
| Photo | Address | Area | Beds / Baths | Price | Details |
|---|---|---|---|---|---|

|
#31
N Skipjack Dr
Cambridge, MD 21613
|
- sq. feet
|
- baths - beds |
show details | |

|
#32
Wood Duck Dr
Cambridge, MD 21613
|
- sq. feet
|
- baths - beds |
show details | |

|
#33
Appleby School Rd
Cambridge, MD 21613
|
- sq. feet
|
- baths - beds |
show details | |

|
Check over 1 million property listings on Foreclosure.com!
|
browse all offers | |||

Latest news about housing in Cambridge, MD collected exclusively by city-data.com from local newspapers, TV, and radio stations

 | New Home Construction in Cambridge, MD (2 replies) |
| Cambridge apartments (0 replies) |
| Need Vacation Home Advice! (2 replies) |
| Relocation to Cambridge, MD (2 replies) |
| Too Many Row Homes (114 replies) |
| Relocating through current job to Hurlock, looking for suitable area to live. (3 replies) |
Median year apartment built: 1973
Household type by relationship:
Households: 13,064- Male householders: 1,950 (734 living alone), Female householders: 3,365 (1,328 living alone)
1,477 spouses (1,462 opposite-sex spouses), 421 unmarried partners, (421 opposite-sex unmarried partners), 4,145 children (3,665 natural, 282 adopted, 198 stepchildren), 305 grandchildren, 216 brothers or sisters, 104 parents, 23 foster children, 201 other relatives, 398 non-relatives
- In group quarters: 455
Size of family households: 1,421 2-persons, 626 3-persons, 710 4-persons, 206 5-persons, 15 7-or-more-persons.
Size of nonfamily households: 2,156 1-person, 314 2-persons, 23 3-persons.
778 married couples with children.
2,238 single-parent households (677 men, 1,561 women).
91.8% of residents of Cambridge speak English at home.
5.6% of residents speak Spanish at home (32% speak English very well, 22% speak English well, 37% speak English not well, 9% don't speak English at all).
1.1% of residents speak other Indo-European language at home (74% speak English very well, 12% speak English well, 14% don't speak English at all).
0.6% of residents speak Asian or Pacific Island language at home (90% speak English very well, 10% speak English well).
0.4% of residents speak other language at home (100% speak English very well).
Foreign born population: 656 (5.0%)
(42.7% of them are naturalized citizens)
| Here: | 6.6 |
| State: | 7.3 |
| Here: | 4.7 |
| State: | 4.2 |

- Bedrooms in owner-occupied houses and condos in Cambridge, Maryland
- 12no bedroom
- 421 bedroom
- 4892 bedrooms
- 1,1753 bedrooms
- 5894 bedrooms
- 995+ bedrooms

- Bedrooms in renter-occupied apartments in Cambridge, Maryland
- 7no bedroom
- 7421 bedroom
- 1,4072 bedrooms
- 6433 bedrooms
- 2414 bedrooms
- 05+ bedrooms

- Cars and other vehicles available in Cambridge in owner-occupied houses/condos
- 122no vehicle
- 6911 vehicle
- 1,0082 vehicles
- 4983 vehicles
- 714 vehicles
- 175+ vehicles

- Cars and other vehicles available in Cambridge in renter-occupied apartments
- 823no vehicle
- 1,4561 vehicle
- 6392 vehicles
- 1223 vehicles
- 04 vehicles
- 05+ vehicles

- Rooms in owner-occupied houses in Cambridge, Maryland
- 121 room
- 02 rooms
- 593 rooms
- 1654 rooms
- 3565 rooms
- 5466 rooms
- 4927 rooms
- 4188 rooms
- 3589+ rooms

- Rooms in renter-occupied apartments in Cambridge, Maryland
- 71 room
- 442 rooms
- 4513 rooms
- 7394 rooms
- 9235 rooms
- 5296 rooms
- 1777 rooms
- 1538 rooms
- 169+ rooms


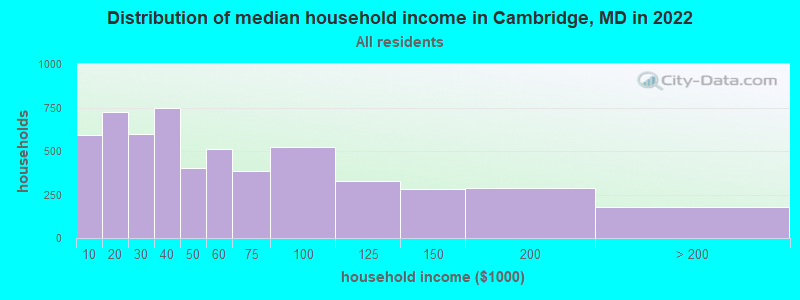
Cambridge, MD household income distribution

- 594Less than $10,000
- 726$10,000 to $19,999
- 599$20,000 to $29,999
- 748$30,000 to $39,999
- 404$40,000 to $49,999
- 513$50,000 to $59,999
- 383$60,000 to $74,999
- 523$75,000 to $99,999
- 328$100,000 to $124,999
- 281$125,000 to $149,999
- 289$150,000 to $199,999
- 181$200,000 or more
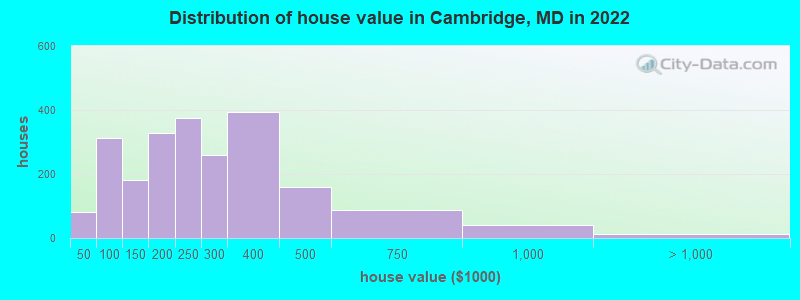
Home value of owner - occupied houses in 2022 in Cambridge, MD
-
- 11Less than $10,000
- 41$15,000 to $19,999
- 8$20,000 to $24,999
- 4$25,000 to $29,999
- 10$30,000 to $34,999
- 5$40,000 to $49,999
- 85$50,000 to $59,999
- 45$60,000 to $69,999
- 19$70,000 to $79,999
- 63$80,000 to $89,999
- 93$90,000 to $99,999
- 103$100,000 to $124,999
- 77$125,000 to $149,999
- 105$150,000 to $174,999
- 220$175,000 to $199,999
- 373$200,000 to $249,999
- 258$250,000 to $299,999
- 392$300,000 to $399,999
- 157$400,000 to $499,999
- 88$500,000 to $749,999
- 41$750,000 to $999,999
- 11$1,000,000 to $1,499,999
Rent paid by renters in 2022 in Cambridge, MD
-
- 32Less than $100
- 46$100 to $149
- 171$150 to $199
- 108$200 to $249
- 39$250 to $299
- 73$300 to $349
- 114$350 to $399
- 113$450 to $499
- 126$500 to $549
- 65$550 to $599
- 84$600 to $649
- 169$650 to $699
- 189$700 to $749
- 386$750 to $799
- 331$800 to $899
- 336$900 to $999
- 194$1,000 to $1,249
- 236$1,250 to $1,499
- 155$1,500 to $1,999
- 127No cash rent


Percentage of workers working in this county: 71.9%
Number of people working at home: 590 (10.3% of all workers)
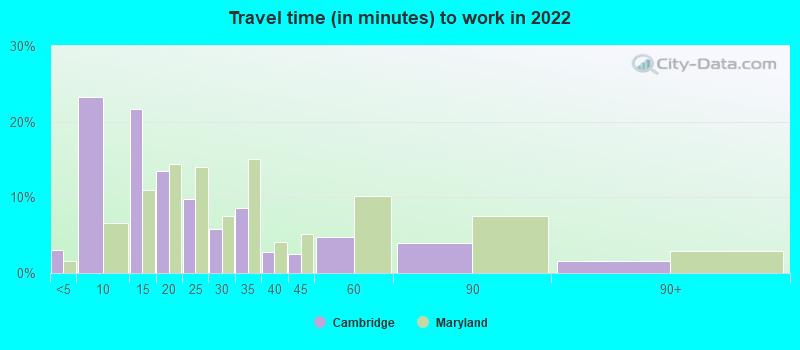
Travel time to work (commute)
- Less than 5 minutes: 181
- 5 to 9 minutes: 1,318
- 10 to 14 minutes: 1,099
- 15 to 19 minutes: 539
- 20 to 24 minutes: 529
- 25 to 29 minutes: 315
- 30 to 34 minutes: 443
- 35 to 39 minutes: 86
- 40 to 44 minutes: 162
- 45 to 59 minutes: 155
- 60 to 89 minutes: 151
- 90 or more minutes: 120
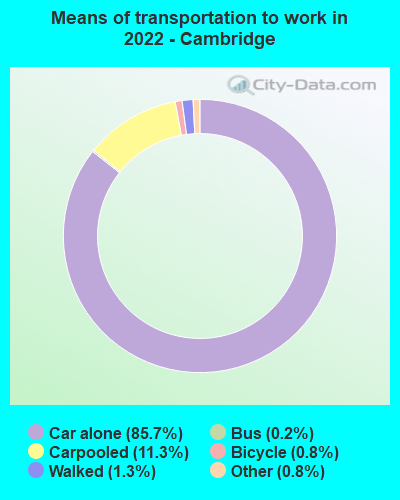
Means of transportation to work:
- Drove a car alone: 5,416 (75.8%)
- Carpooled: 761 (10.7%)
- Bus: 7 (0.1%)
- Taxi: 55 (0.8%)
- Bicycle: 54 (0.8%)
- Walked: 78 (1.1%)
- Worked at home: 590 (8.3%)

- Unemployment by race in 2022
- Unemployment rate for White non-Hispanic residents
- 10.2%Males
- 4.1%Females
- Unemployment rate for Black residents
- 7.3%Males
- 4.7%Females
- Unemployment rate for Asian residents
- 7.1%Females
- Unemployment rate for two or more race residents
- 7.3%Males

- Year of entry for the foreign-born population in Cambridge, Maryland
- 2242010 or later
- 1242000 to 2009
- 971990 to 1999
- 241980 to 1989
- 201970 to 1979
- 44Before 1970

First ancestries reported:
- American: 1,109 (13.4%)
- English: 630 (7.6%)
- German: 297 (3.6%)
- Irish: 260 (3.1%)
- Nigerian: 152 (1.8%)
- Italian: 124 (1.5%)
- British West Indian: 92 (1.1%)
- Polish: 52 (0.6%)
- Swedish: 44 (0.5%)
- Scottish: 41 (0.5%)
- Dutch: 36 (0.4%)
- European: 35 (0.4%)
- African: 28 (0.3%)
- French: 26 (0.3%)
- Danish: 15 (0.2%)
- Jamaican: 15 (0.2%)
- British: 10 (0.1%)
- Norwegian: 9 (0.1%)
- Eastern European: 8 (0.10%)
- French Canadian: 4 (0.05%)
- Barbadian: 4 (0.05%)
- Scandinavian: 3 (0.04%)
- Haitian: 3 (0.04%)
- Welsh: 2 (0.02%)
Most common places of birth for foreign-born residents (%):
| Cambridge: | 19.4% (127) |
| Maryland: | 12.0% (115,412) |
| Cambridge: | 16.2% (106) |
| Maryland: | 0.1% (916) |
| Cambridge: | 8.4% (55) |
| Maryland: | 3.5% (34,065) |
| Cambridge: | 6.7% (44) |
| Maryland: | 4.6% (44,825) |
| Cambridge: | 5.2% (34) |
| Maryland: | 2.5% (24,026) |
| Cambridge: | 4.1% (27) |
| Maryland: | 0.4% (3,874) |
| Cambridge: | 4.0% (26) |
| Maryland: | 0.9% (9,100) |
| Cambridge: | 3.7% (24) |
| Maryland: | 0.1% (789) |
| Cambridge: | 3.5% (23) |
| Maryland: | 0.2% (1,463) |
| Cambridge: | 3.5% (23) |
| Maryland: | 4.6% (44,742) |
| Cambridge: | 3.4% (22) |
| Maryland: | 1.2% (11,265) |
| Cambridge: | 2.9% (19) |
| Maryland: | 0.2% (1,581) |
| Cambridge: | 2.7% (18) |
| Maryland: | 0.5% (4,689) |
| Cambridge: | 2.3% (15) |
| Maryland: | 2.8% (27,444) |
| Cambridge: | 2.0% (13) |
| Maryland: | 0.1% (1,206) |
| Cambridge: | 1.7% (11) |
| Maryland: | 6.4% (61,725) |
| Cambridge: | 1.7% (11) |
| Maryland: | 0.1% (581) |
| Cambridge: | 1.7% (11) |
| Maryland: | 0.5% (4,596) |
Place of birth for U.S.-born residents:
- This state: 9,365
- Other state: 2,620
- Northeast: 544
- Midwest: 412
- South: 1,331
- West: 346
91.7% of Cambridge residents lived in the same house 1 years ago.
Out of people who lived in different houses, 39.4% lived in this county.
Out of people who lived in different counties, 59.8% lived in Maryland.
| Cambridge: | 91.7% |
| State average: | 88.5% |
Education attainment for males 25 years and older:
- No schooling: 64
- Nursery to 4th grade: 46
- 5th and 6th grade: 0
- 7th and 8th grade: 29
- 9th grade: 8
- 10th grade: 170
- 11th grade: 135
- 12th grade, no diploma: 41
- High school graduate (or equivalency): 1,705
- Less than 1 year of college: 282
- Some college more than 1 year, no degree: 478
- Associate degree: 221
- Bachelor's degree: 410
- Master's degree: 270
- Professional school degree: 22
- Doctorate degree: 34

Education attainment for females 25 years and older:
- No schooling: 70
- Nursery to 4th grade: 15
- 5th and 6th grade: 32
- 7th and 8th grade: 26
- 9th grade: 88
- 10th grade: 75
- 11th grade: 170
- 12th grade, no diploma: 68
- High school graduate (or equivalency): 1,560
- Less than 1 year of college: 447
- Some college more than 1 year, no degree: 618
- Associate degree: 540
- Bachelor's degree: 546
- Master's degree: 476
- Professional school degree: 18
- Doctorate degree: 87

Housing units in structures:
- One, detached: 3,701
- One, attached: 706
- Two: 244
- 3 or 4: 493
- 5 to 9: 647
- 10 to 19: 190
- 20 to 49: 312
- 50 or more: 178
- Mobile homes: 114
Median worth of mobile homes: $17,642
Housing units lacking complete kitchen facilities in 2022: 2.6%
House/condo owner moved in on average 9 years ago
Renter moved in on average 6 years ago

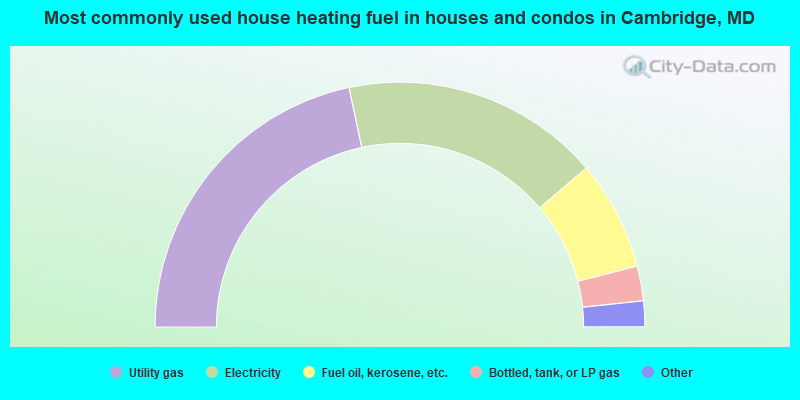
- 43.4%Utility gas
- 34.2%Electricity
- 14.5%Fuel oil, kerosene, etc.
- 4.6%Bottled, tank, or LP gas
- 0.9%No fuel used
- 0.9%Solar energy
- 0.7%Coal or coke
- 0.7%Wood
- 0.3%Other fuel
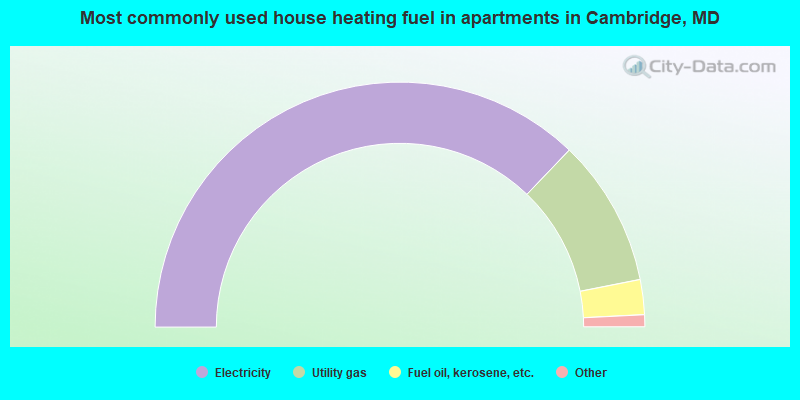
- 74.3%Electricity
- 19.5%Utility gas
- 4.6%Fuel oil, kerosene, etc.
- 1.1%Bottled, tank, or LP gas
- 0.5%Wood
Private vs. public school enrollment:
| Here: | 8.7% |
| Maryland: | 15.2% |
| Here: | 0.8% |
| Maryland: | 14.4% |
| Here: | 18.9% |
| Maryland: | 20.2% |


