Races in Cambridge, Maryland (MD) Detailed Stats
Data:
Races - White alone (%)
Races - White alone (% change since 2000)
Races - Black alone (%)
Races - Black alone (% change since 2000)
Races - American Indian alone (%)
Races - American Indian alone (% change since 2000)
Races - Asian alone (%)
Races - Asian alone (% change since 2000)
Races - Hispanic (%)
Races - Hispanic (% change since 2000)
Races - Native Hawaiian and Other Pacific Islander alone (%)
Races - Native Hawaiian and Other Pacific Islander alone (% change since 2000)
Races - Two or more races(%)
Races - Two or more races(% change since 2000)
Races - Other race alone (%)
Races - Other race alone (% change since 2000)
Racial diversity
Place of birth - Born in state of residence (%)
Place of birth - Born in state of residence (%) - White
Place of birth - Born in state of residence (%) - Black or African American
Place of birth - Born in state of residence (%) - Asian
Place of birth - Born in state of residence (%) - Hispanic or Latino
Place of birth - Born in state of residence (%) - American Indian and Alaska Native
Place of birth - Born in state of residence (%) - Multirace
Place of birth - Born in state of residence (%) - Other Race
Place of birth - Born in other state (%)
Place of birth - Born in other state (%) - White
Place of birth - Born in other state (%) - Black or African American
Place of birth - Born in other state (%) - Asian
Place of birth - Born in other state (%) - Hispanic or Latino
Place of birth - Born in other state (%) - American Indian and Alaska Native
Place of birth - Born in other state (%) - Multirace
Place of birth - Born in other state (%) - Other Race
Place of birth - Native, outside of US (%)
Place of birth - Native, outside of US (%) - White
Place of birth - Native, outside of US (%) - Black or African American
Place of birth - Native, outside of US (%) - Asian
Place of birth - Native, outside of US (%) - Hispanic or Latino
Place of birth - Native, outside of US (%) - American Indian and Alaska Native
Place of birth - Native, outside of US (%) - Multirace
Place of birth - Native, outside of US (%) - Other Race
Place of birth - Foreign born (%)
Place of birth - Foreign born (%) - White
Place of birth - Foreign born (%) - Black or African American
Place of birth - Foreign born (%) - Asian
Place of birth - Foreign born (%) - Hispanic or Latino
Place of birth - Foreign born (%) - American Indian and Alaska Native
Place of birth - Foreign born (%) - Multirace
Place of birth - Foreign born (%) - Other Race
Residents speaking English at home (%)
Residents speaking English at home - Born in the United States (%)
Residents speaking English at home - Native, born elsewhere (%)
Residents speaking English at home - Foreign born (%)
Residents speaking Spanish at home (%)
Residents speaking Spanish at home - Born in the United States (%)
Residents speaking Spanish at home - Native, born elsewhere (%)
Residents speaking Spanish at home - Foreign born (%)
Residents speaking other language at home (%)
Residents speaking other language at home - Born in the United States (%)
Residents speaking other language at home - Native, born elsewhere (%)
Residents speaking other language at home - Foreign born (%)
Marital status - Never married (%)
Marital status - Now married (%)
Marital status - Separated (%)
Marital status - Widowed (%)
Marital status - Divorced (%)
Ancestries Reported - Arab (%)
Ancestries Reported - Czech (%)
Ancestries Reported - Danish (%)
Ancestries Reported - Dutch (%)
Ancestries Reported - English (%)
Ancestries Reported - French (%)
Ancestries Reported - French Canadian (%)
Ancestries Reported - German (%)
Ancestries Reported - Greek (%)
Ancestries Reported - Hungarian (%)
Ancestries Reported - Irish (%)
Ancestries Reported - Italian (%)
Ancestries Reported - Lithuanian (%)
Ancestries Reported - Norwegian (%)
Ancestries Reported - Polish (%)
Ancestries Reported - Portuguese (%)
Ancestries Reported - Russian (%)
Ancestries Reported - Scotch-Irish (%)
Ancestries Reported - Scottish (%)
Ancestries Reported - Slovak (%)
Ancestries Reported - Subsaharan African (%)
Ancestries Reported - Swedish (%)
Ancestries Reported - Swiss (%)
Ancestries Reported - Ukrainian (%)
Ancestries Reported - United States (%)
Ancestries Reported - Welsh (%)
Ancestries Reported - West Indian (%)
Ancestries Reported - Other (%)
Geographical mobility - Same house 1 year ago (%)
Geographical mobility - Same house 1 year ago (%) - White
Geographical mobility - Same house 1 year ago (%) - Black or African American
Geographical mobility - Same house 1 year ago (%) - Asian
Geographical mobility - Same house 1 year ago (%) - Hispanic or Latino
Geographical mobility - Same house 1 year ago (%) - American Indian and Alaska Native
Geographical mobility - Same house 1 year ago (%) - Multirace
Geographical mobility - Same house 1 year ago (%) - Other Race
Geographical mobility - Moved within same county (%)
Geographical mobility - Moved within same county (%) - White
Geographical mobility - Moved within same county (%) - Black or African American
Geographical mobility - Moved within same county (%) - Asian
Geographical mobility - Moved within same county (%) - Hispanic or Latino
Geographical mobility - Moved within same county (%) - American Indian and Alaska Native
Geographical mobility - Moved within same county (%) - Multirace
Geographical mobility - Moved within same county (%) - Other Race
Geographical mobility - Moved from different county within same state (%)
Geographical mobility - Moved from different county within same state (%) - White
Geographical mobility - Moved from different county within same state (%) - Black or African American
Geographical mobility - Moved from different county within same state (%) - Asian
Geographical mobility - Moved from different county within same state (%) - Hispanic or Latino
Geographical mobility - Moved from different county within same state (%) - American Indian and Alaska Native
Geographical mobility - Moved from different county within same state (%) - Multirace
Geographical mobility - Moved from different county within same state (%) - Other Race
Geographical mobility - Moved from different state (%)
Geographical mobility - Moved from different state (%) - White
Geographical mobility - Moved from different state (%) - Black or African American
Geographical mobility - Moved from different state (%) - Asian
Geographical mobility - Moved from different state (%) - Hispanic or Latino
Geographical mobility - Moved from different state (%) - American Indian and Alaska Native
Geographical mobility - Moved from different state (%) - Multirace
Geographical mobility - Moved from different state (%) - Other Race
Geographical mobility - Moved from abroad (%)
Geographical mobility - Moved from abroad (%) - White
Geographical mobility - Moved from abroad (%) - Black or African American
Geographical mobility - Moved from abroad (%) - Asian
Geographical mobility - Moved from abroad (%) - Hispanic or Latino
Geographical mobility - Moved from abroad (%) - American Indian and Alaska Native
Geographical mobility - Moved from abroad (%) - Multirace
Geographical mobility - Moved from abroad (%) - Other Race
Place of birth for the foreign-born population - Ireland (%)
Place of birth for the foreign-born population - Denmark (%)
Place of birth for the foreign-born population - Norway (%)
Place of birth for the foreign-born population - Sweden (%)
Place of birth for the foreign-born population - United Kingdom (%)
Place of birth for the foreign-born population - England (%)
Place of birth for the foreign-born population - Scotland (%)
Place of birth for the foreign-born population - Other Northern Europe (%)
Place of birth for the foreign-born population - Austria (%)
Place of birth for the foreign-born population - Belgium (%)
Place of birth for the foreign-born population - France (%)
Place of birth for the foreign-born population - Germany (%)
Place of birth for the foreign-born population - Netherlands (%)
Place of birth for the foreign-born population - Switzerland (%)
Place of birth for the foreign-born population - Other Western Europe (%)
Place of birth for the foreign-born population - Greece (%)
Place of birth for the foreign-born population - Italy (%)
Place of birth for the foreign-born population - Portugal (%)
Place of birth for the foreign-born population - Spain (%)
Place of birth for the foreign-born population - Other Southern Europe (%)
Place of birth for the foreign-born population - Albania (%)
Place of birth for the foreign-born population - Belarus (%)
Place of birth for the foreign-born population - Bosnia and Herzegovina (%)
Place of birth for the foreign-born population - Bulgaria (%)
Place of birth for the foreign-born population - Croatia (%)
Place of birth for the foreign-born population - Czechoslovakia (%)
Place of birth for the foreign-born population - Hungary (%)
Place of birth for the foreign-born population - Latvia (%)
Place of birth for the foreign-born population - Lithuania (%)
Place of birth for the foreign-born population - North Macedonia (Macedonia) (%)
Place of birth for the foreign-born population - Moldova (%)
Place of birth for the foreign-born population - Poland (%)
Place of birth for the foreign-born population - Romania (%)
Place of birth for the foreign-born population - Russia (%)
Place of birth for the foreign-born population - Serbia (%)
Place of birth for the foreign-born population - Ukraine (%)
Place of birth for the foreign-born population - Other Eastern Europe (%)
Place of birth for the foreign-born population - China (%)
Place of birth for the foreign-born population - Hong Kong (%)
Place of birth for the foreign-born population - Taiwan (%)
Place of birth for the foreign-born population - Japan (%)
Place of birth for the foreign-born population - Korea (%)
Place of birth for the foreign-born population - Other Eastern Asia (%)
Place of birth for the foreign-born population - Afghanistan (%)
Place of birth for the foreign-born population - Bangladesh (%)
Place of birth for the foreign-born population - India (%)
Place of birth for the foreign-born population - Iran (%)
Place of birth for the foreign-born population - Kazakhstan (%)
Place of birth for the foreign-born population - Nepal (%)
Place of birth for the foreign-born population - Pakistan (%)
Place of birth for the foreign-born population - Sri Lanka (%)
Place of birth for the foreign-born population - Uzbekistan (%)
Place of birth for the foreign-born population - Other South Central Asia (%)
Place of birth for the foreign-born population - Burma (%)
Place of birth for the foreign-born population - Cambodia (%)
Place of birth for the foreign-born population - Indonesia (%)
Place of birth for the foreign-born population - Laos (%)
Place of birth for the foreign-born population - Malaysia (%)
Place of birth for the foreign-born population - Philippines (%)
Place of birth for the foreign-born population - Singapore (%)
Place of birth for the foreign-born population - Thailand (%)
Place of birth for the foreign-born population - Vietnam (%)
Place of birth for the foreign-born population - Other South Eastern Asia (%)
Place of birth for the foreign-born population - Armenia (%)
Place of birth for the foreign-born population - Iraq (%)
Place of birth for the foreign-born population - Israel (%)
Place of birth for the foreign-born population - Jordan (%)
Place of birth for the foreign-born population - Kuwait (%)
Place of birth for the foreign-born population - Lebanon (%)
Place of birth for the foreign-born population - Saudi Arabia (%)
Place of birth for the foreign-born population - Syria (%)
Place of birth for the foreign-born population - Turkey (%)
Place of birth for the foreign-born population - Yemen (%)
Place of birth for the foreign-born population - Other Western Asia (%)
Place of birth for the foreign-born population - Eritrea (%)
Place of birth for the foreign-born population - Ethiopia (%)
Place of birth for the foreign-born population - Kenya (%)
Place of birth for the foreign-born population - Somalia (%)
Place of birth for the foreign-born population - Uganda (%)
Place of birth for the foreign-born population - Zimbabwe (%)
Place of birth for the foreign-born population - Other Eastern Africa (%)
Place of birth for the foreign-born population - Cameroon (%)
Place of birth for the foreign-born population - Congo (%)
Place of birth for the foreign-born population - Democratic Republic of Congo (Zaire) (%)
Place of birth for the foreign-born population - Other Middle Africa (%)
Place of birth for the foreign-born population - Egypt (%)
Place of birth for the foreign-born population - Morocco (%)
Place of birth for the foreign-born population - Sudan (%)
Place of birth for the foreign-born population - Other Northern Africa (%)
Place of birth for the foreign-born population - South Africa (%)
Place of birth for the foreign-born population - Other Southern Africa (%)
Place of birth for the foreign-born population - Cabo Verde (%)
Place of birth for the foreign-born population - Ghana (%)
Place of birth for the foreign-born population - Liberia (%)
Place of birth for the foreign-born population - Nigeria (%)
Place of birth for the foreign-born population - Senegal (%)
Place of birth for the foreign-born population - Sierra Leone (%)
Place of birth for the foreign-born population - Other Western Africa (%)
Place of birth for the foreign-born population - Australia (%)
Place of birth for the foreign-born population - New Zealand (%)
Place of birth for the foreign-born population - Fiji (%)
Place of birth for the foreign-born population - Micronesia (%)
Place of birth for the foreign-born population - Bahamas (%)
Place of birth for the foreign-born population - Barbados (%)
Place of birth for the foreign-born population - Cuba (%)
Place of birth for the foreign-born population - Dominica (%)
Place of birth for the foreign-born population - Dominican Republic (%)
Place of birth for the foreign-born population - Grenada (%)
Place of birth for the foreign-born population - Haiti (%)
Place of birth for the foreign-born population - Jamaica (%)
Place of birth for the foreign-born population - St. Vincent and the Grenadines (%)
Place of birth for the foreign-born population - Trinidad and Tobago (%)
Place of birth for the foreign-born population - West Indies (%)
Place of birth for the foreign-born population - Other Caribbean (%)
Place of birth for the foreign-born population - Belize (%)
Place of birth for the foreign-born population - Costa Rica (%)
Place of birth for the foreign-born population - El Salvador (%)
Place of birth for the foreign-born population - Guatemala (%)
Place of birth for the foreign-born population - Honduras (%)
Place of birth for the foreign-born population - Mexico (%)
Place of birth for the foreign-born population - Nicaragua (%)
Place of birth for the foreign-born population - Panama (%)
Place of birth for the foreign-born population - Other Central America (%)
Place of birth for the foreign-born population - Argentina (%)
Place of birth for the foreign-born population - Bolivia (%)
Place of birth for the foreign-born population - Brazil (%)
Place of birth for the foreign-born population - Chile (%)
Place of birth for the foreign-born population - Colombia (%)
Place of birth for the foreign-born population - Ecuador (%)
Place of birth for the foreign-born population - Guyana (%)
Place of birth for the foreign-born population - Peru (%)
Place of birth for the foreign-born population - Uruguay (%)
Place of birth for the foreign-born population - Venezuela (%)
Place of birth for the foreign-born population - Other South America (%)
Place of birth for the foreign-born population - Canada (%)
Place of birth for the foreign-born population - Other Northern America (%)
Place of birth for the foreign-born population - Other (%)
Latest news about races in Cambridge, MD collected exclusively by city-data.com from local newspapers, TV, and radio stations
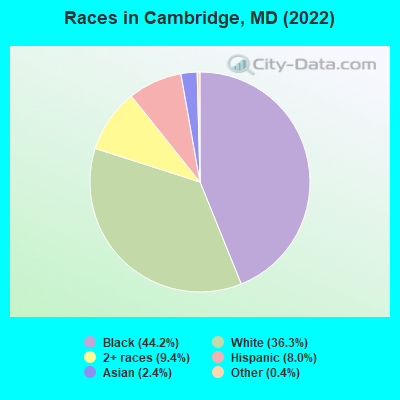
According to 2022 data, the most numerous races in Cambridge, MD are White alone (4,737 residents), Black alone (5,769 residents), and Hispanic (1,048 residents). 91.5% of Cambridge residents speak English at home. 5.0% of Cambridge, MD residents are foreign-born (2.7% born in Latin America, 0.8% born in Europe, 0.8% born in Asia), which is 218.6% less than the foreign-born rate of 16.0% across the entire state of Maryland.
Race distribution in Cambridge
2000 2022
3,286,547 62.1% White alone 1,464,735 27.7% Black alone 227,916 4.3% Hispanic 209,738 4.0% Asian alone 82,946 1.6% Two or more races 13,312 0.3% American Indian alone 9,379 0.2% Other race alone 1,913 0.04% Native Hawaiian and Other
2,906,492 47.1% White alone 1,800,914 29.2% Black alone 705,842 11.4% Hispanic 401,818 6.5% Asian alone 291,317 4.7% Two or more races 46,930 0.8% Other race alone 8,930 0.1% American Indian alone 2,417 0.04% Native Hawaiian and Other
Income and house value in Cambridge Median household income in 2022 $54,404 White non-Hispanic householders$35,679 Black householders$34,774 Asian householders$63,879 Some other race householders$51,100 Two or more races householdersMedian 2022 house value $248,322 White Non-Hispanic householders$200,966 Black or African American householders$192,383 Two or more races householders$133,188 Hispanic or Latino householders
Median age by race in Cambridge
53.6 Median age for White residents49.7 55.2 35.3 Median age for Black or African American residents35.7 33.7 -647,863,247.2 Median age for American Indian / Alaska Native residents-642,487,046.0 -676,818,950.3 32.1 Median age for Asian residents32.7 24.8 -763,333,332.6 Median age for Native Hawaiian / Pacific Islander residents-720,061,021.4 -760,942,760.2 21.9 Median age for Other race residents31.8 22.1 18.5 Median age for Two or more races residents18.3 19.8 54.0 Median age for White alone residents52.0 57.0 21.6 Median age for Hispanic or Latino residents18.3 33.2
Owner/renter occupied households by race in Cambridge
House owners and renters - White residents 1,539 63.4% Owner occupied888 36.6% Renter occupiedHouse owners and renters - Black or African American residents 682 28.8% Owner occupied1,690 71.2% Renter occupiedHouse owners and renters - Asian residents 38 34.2% Owner occupied74 65.8% Renter occupiedHouse owners and renters - Other race residents 31 24.0% Owner occupied98 76.0% Renter occupiedHouse owners and renters - Two or more races residents 103 26.9% Owner occupied280 73.1% Renter occupiedHouse owners and renters - White alone residents 1,545 66.5% Owner occupied778 33.5% Renter occupiedHouse owners and renters - Hispanic or Latino residents 65 19.3% Owner occupied271 80.7% Renter occupied
Language usage in Cambridge
English speakers - Total 91.5% of residents of Cambridge speak English at home.
5.6% of residents speak Spanish at home 222 32.5% Speak English very well462 67.5% Speak English less than very well2.2% of residents speak other language at home 220 83.3% Speak English very well44 16.7% Speak English less than very well
English speakers - Born in the United States 96.9% of residents of Cambridge speak English at home.
1.1% of residents speak Spanish at home 28 100.0% Speak English very well1.7% of residents speak other language at home 27 62.8% Speak English very well16 37.2% Speak English less than very well
English speakers - Native, born elsewhere 38.1% of residents of Cambridge speak English at home.
63.5% of residents speak Spanish at home 43 17.8% Speak English very well199 82.2% Speak English less than very well1.8% of residents speak other language at home 7 100.0% Speak English less than very well
English speakers - Foreign-born 45.9% of residents of Cambridge speak English at home.
27.1% of residents speak Spanish at home 26 14.6% Speak English very well152 85.4% Speak English less than very well28.0% of residents speak other language at home 164 89.1% Speak English very well20 10.9% Speak English less than very well
White (Caucasian) - Speak only English Native:
98.2% (4,499)Foreign-born:
43.0% (38)
White (Caucasian) - Speak another language Native:
2.1% (95)Foreign-born:
60.3% (53)
Black or African American - Speak only English Native:
98.9% (4,879)Foreign-born:
79.0% (186)
Black or African American - Speak another language Native:
0.9% (44)Foreign-born:
18.7% (44)
Asian - Speak only English Native:
89.7% (191)Foreign-born:
29.7% (30)
Asian - Speak another language Native:
7.8% (17)Foreign-born:
72.4% (74)
Other race - Speak only English Native:
5.1% (23)Foreign-born:
41.4% (28)
Other race - Speak another language Native:
90.3% (413)Foreign-born:
53.1% (36)
Two or more races - Speak only English Native:
98.0% (1,372)Foreign-born:
10.4% (20)
Two or more races - Speak another language Native:
0.3% (4)Foreign-born:
89.6% (171)
White alone - Speak only English Native:
98.5% (4,395)Foreign-born:
40.1% (39)
White alone - Speak another language Native:
1.5% (66)Foreign-born:
59.5% (59)
Hispanic or Latino - Speak only English Native:
43.2% (326)Foreign-born:
12.4% (25)
Hispanic or Latino - Speak another language Native:
56.9% (429)Foreign-born:
86.9% (176)
Foreign-born residents in Cambridge 656 residents are foreign born (2.7% Latin America , 0.8% Europe , 0.8% Asia ).
This city:
5.0%Maryland:
15.7%
Marital status for residents in Cambridge Marital status - White (Caucasian) population 15 years and over
Males 35.5% Never married43.7% Now married0.6% Separated11.2% Widowed9.0% DivorcedFemales 23.7% Never married36.9% Now married1.0% Separated14.2% Widowed24.2% DivorcedWomen who gave birth in the past 12 months Now married:
77.0% (44)Unmarried:
23.0% (13)
Women who did not give birth in the past 12 months Now married:
29.1% (267)Unmarried:
70.9% (651)
Marital status - Black or African American population 15 years and over
Males 51.5% Never married29.7% Now married3.1% Separated2.0% Widowed13.7% DivorcedFemales 48.4% Never married28.3% Now married2.5% Separated5.6% Widowed15.2% DivorcedWomen who gave birth in the past 12 months Now married:
0.0% (0)Unmarried:
100.0% (58)
Women who did not give birth in the past 12 months Now married:
29.1% (381)Unmarried:
70.9% (927)
Marital status - Asian population 15 years and over
Males 52.0% Never married0.0% Now married0.0% Separated0.0% Widowed48.0% DivorcedFemales 48.7% Never married51.3% Now married0.0% Separated0.0% Widowed0.0% DivorcedWomen who did not give birth in the past 12 months Now married:
45.1% (92)Unmarried:
54.9% (112)
Marital status - Other race population 15 years and over
Males 49.8% Never married15.4% Now married34.8% Separated0.0% Widowed0.0% DivorcedFemales 52.6% Never married43.4% Now married0.0% Separated0.0% Widowed3.9% DivorcedWomen who gave birth in the past 12 months Now married:
85.0% (21)Unmarried:
15.0% (4)
Women who did not give birth in the past 12 months Now married:
39.4% (103)Unmarried:
60.6% (158)
Marital status - Two or more races population 15 years and over
Males 79.8% Never married15.1% Now married0.0% Separated0.0% Widowed5.2% DivorcedFemales 57.3% Never married23.9% Now married0.0% Separated2.1% Widowed16.7% DivorcedWomen who did not give birth in the past 12 months Now married:
25.8% (118)Unmarried:
74.2% (339)
Marital status - White alone, not Hispanic / Latino population 15 years and over
Males 35.4% Never married43.7% Now married0.6% Separated11.3% Widowed9.1% DivorcedFemales 20.1% Never married39.3% Now married1.0% Separated14.8% Widowed24.8% DivorcedWomen who gave birth in the past 12 months Now married:
77.0% (45)Unmarried:
23.0% (14)
Women who did not give birth in the past 12 months Now married:
34.0% (276)Unmarried:
66.0% (536)
Marital status - Hispanic or Latino population 15 years and over
Males 66.1% Never married10.4% Now married23.5% Separated0.0% Widowed0.0% DivorcedFemales 67.6% Never married24.5% Now married0.0% Separated1.6% Widowed6.3% DivorcedWomen who gave birth in the past 12 months Now married:
100.0% (18)Unmarried:
0.0% (0)
Women who did not give birth in the past 12 months Now married:
22.2% (110)Unmarried:
77.8% (387)
Ancestries in Cambridge
1,109 13.4% American630 7.6% English297 3.6% German260 3.1% Irish152 1.8% Nigerian124 1.5% Italian92 1.1% British West Indian52 0.6% Polish44 0.5% Swedish41 0.5% Scottish36 0.4% Dutch35 0.4% European28 0.3% African26 0.3% French15 0.2% Danish15 0.2% Jamaican10 0.1% British9 0.1% Norwegian8 0.10% Eastern European4 0.05% French Canadian4 0.05% Barbadian3 0.04% Scandinavian3 0.04% Haitian2 0.02% Welsh
Children Nativity (place of birth) in Cambridge
Children under 6 years - Living with two parents Both parents native 171 100.0% NativeBoth parents foreign-born 79 100.0% NativeChildren under 6 years - Living with one parent Native parent 688 100.0% NativeForeign-born parent 58 49.1% Native60 50.9% Foreign-bornChildren 6 to 17 years - Living with two parents Both parents native 485 100.0% NativeBoth parents foreign-born 8 100.0% NativeOne native, one foreign-born parent 33 100.0% NativeChildren 6 to 17 years - Living with one parent Native parent 1,330 100.0% NativeForeign-born parent 93 50.9% Native90 49.1% Foreign-born
Grandparents responsible for own grandchildren in Cambridge
Grandparents (30 to 59 years) White / Caucasian 4 100.0% Not responsible for grandchildrenBlack or African American 8 45.2% Responsible for grandchildren10 54.8% Not responsible for grandchildrenTwo or more races 35 100.0% Responsible for grandchildrenWhite alone, not Hispanic / Latino 4 100.0% Not responsible for grandchildrenGrandparents (60 years and over) Black or African American 21 34.4% Responsible for grandchildren39 65.6% Not responsible for grandchildren