Cambridge Springs, PA (Pennsylvania) Houses and Residents
| Cambridge Springs: | $116,235 |
| Pennsylvania: | $245,500 |
Mean price in 2022:
Detached houses: $112,402
Here: $112,402 State: $317,202 Townhouses or other attached units: $126,175
Here: $126,175 State: $254,369 In 2-unit structures: $107,171
Here: $107,171 State: $249,182
Total population: 2,528 (Urban population: 0, Rural population: 2,324 (all nonfarm))
Houses: 673 (641 occupied: 376 owner occupied, 299 renter occupied)
| % of renters here: | 44% |
| State: | 31% |
Housing density: 776 houses/condos per square mile
Median price asked for vacant for-sale houses and condos in 2022 in this county: $84,105.
Median contract rent in 2022: $502 (lower quartile is $417, upper quartile is $560)
Median rent asked for vacant for-rent units in 2022: $577
Median gross rent in Cambridge Springs, PA in 2022: $604
Housing units in Cambridge Springs with a mortgage: 246 (26 second mortgage, 0 home equity loan, 28 both second mortgage and home equity loan)
Houses without a mortgage: 8
Median household income for houses/condos with a mortgage: $71,978
Median household income for apartments without a mortgage: $61,906
Median monthly housing costs: $701
Compare current foreclosures near Cambridge Springs, PA:
| Photo | Address | Area | Beds / Baths | Price | Details |
|---|---|---|---|---|---|

|
#1
Blystone Rd
Cambridge Springs, PA 16403
|
- sq. feet
|
- baths - beds |
show details | |

|
#2
Beach Ave
Cambridge Springs, PA 16403
|
- sq. feet
|
- baths - beds |
show details | |

|
#3
S Main St
Cambridge Springs, PA 16403
|
- sq. feet
|
- baths - beds |
show details | |

|
#4
Hogback West Rd
Cambridge Springs, PA 16403
|
- sq. feet
|
- baths - beds |
show details | |

|
#5
Venango Ave # 2
Cambridge Springs, PA 16403
|
- sq. feet
|
- baths - beds |
show details | |

|
#6
Center St
Cambridge Springs, PA 16403
|
- sq. feet
|
- baths - beds |
show details | |

|
#7
Sherwood Dr # 26
Cambridge Springs, PA 16403
|
- sq. feet
|
- baths - beds |
show details | |

|
#8
Poplar St
Cambridge Springs, PA 16403
|
- sq. feet
|
- baths - beds |
show details | |

|
#9
Warden St
Union City, PA 16438
|
1,228 sq. feet
|
1 baths 3 beds |
show details | |

|
#10
N Main St
Meadville, PA 16335
|
1,568 sq. feet
|
1 baths 2 beds |
show details |
| Photo | Address | Area | Beds / Baths | Price | Details |
|---|---|---|---|---|---|

|
#11
Walnut St
Edinboro, PA 16412
|
624 sq. feet
|
1 baths 3 beds |
show details | |

|
#12
Hank St
Meadville, PA 16335
|
1,500 sq. feet
|
2 baths 3 beds |
show details | |

|
#13
Vernon St
Meadville, PA 16335
|
1,920 sq. feet
|
1 baths 3 beds |
show details | |

|
#14
Old Waterford Rd
Erie, PA 16509
|
1,428 sq. feet
|
2 baths 3 beds |
show details | |

|
#15
Warden St
Union City, PA 16438
|
1,278 sq. feet
|
1 baths 3 beds |
show details | |

|
#16
Lincolnville Rd
Union City, PA 16438
|
1,064 sq. feet
|
1 baths 3 beds |
show details | |

|
#17
Elm St
Union City, PA 16438
|
768 sq. feet
|
1 baths 1 beds |
show details | |

|
#18
Route 6n
Edinboro, PA 16412
|
2,280 sq. feet
|
2 baths 3 beds |
show details | |

|
#19
Chestnut St
Meadville, PA 16335
|
- sq. feet
|
4 baths 6 beds |
show details | |

|
#20
Murray Rd
Union City, PA 16438
|
1,600 sq. feet
|
1 baths 1 beds |
show details |
| Photo | Address | Area | Beds / Baths | Price | Details |
|---|---|---|---|---|---|

|
#21
Lake Pleasant Rd
Union City, PA 16438
|
1,300 sq. feet
|
2 baths 3 beds |
show details | |

|
#22
Sterrettania Rd
Fairview, PA 16415
|
1,960 sq. feet
|
2 baths 3 beds |
show details | |

|
#23
Crane St
Cranesville, PA 16410
|
1,096 sq. feet
|
1 baths 3 beds |
show details | |

|
#24
Parade St
Union City, PA 16438
|
1,056 sq. feet
|
1 baths 2 beds |
show details | |

|
#25
Chestnut St
Meadville, PA 16335
|
- sq. feet
|
1 baths 4 beds |
show details | |

|
#26
Fry Rd
Mc Kean, PA 16426
|
2,016 sq. feet
|
1 baths 4 beds |
show details | |

|
#27
Neyland Rd
Edinboro, PA 16412
|
1,280 sq. feet
|
1 baths 3 beds |
show details | |

|
#28
Sterrettania Rd
Girard, PA 16417
|
1,428 sq. feet
|
1 baths 3 beds |
show details | |

|
#29
Deer St
Albion, PA 16401
|
1,440 sq. feet
|
1 baths 3 beds |
show details | |

|
#30
Edinboro Rd
Mc Kean, PA 16426
|
1,165 sq. feet
|
1 baths 3 beds |
show details |
| Photo | Address | Area | Beds / Baths | Price | Details |
|---|---|---|---|---|---|

|
#31
Dorn Rd
Waterford, PA 16441
|
1,560 sq. feet
|
2 baths 3 beds |
show details | |

|
#32
Pagan Rd
Erie, PA 16509
|
1,440 sq. feet
|
1 baths 3 beds |
show details | |

|
#33
Valley View Cir
Erie, PA 16509
|
2,240 sq. feet
|
2 baths 3 beds |
show details | |

|
#34
Crane St
Cranesville, PA 16410
|
1,498 sq. feet
|
1 baths 3 beds |
show details | |

|
#35
Beau Dr
Edinboro, PA 16412
|
3,230 sq. feet
|
3 baths 4 beds |
show details | |

|
#36
State Rd
Cranesville, PA 16410
|
1,948 sq. feet
|
2 baths 3 beds |
show details | |

|
#37
Mayfair Dr
Mc Kean, PA 16426
|
2,008 sq. feet
|
2 baths 4 beds |
show details | |

|
#38
Dundon Rd
Edinboro, PA 16412
|
1,882 sq. feet
|
2 baths 3 beds |
show details | |

|
#39
Route 6
Waterford, PA 16441
|
1,440 sq. feet
|
1 baths 2 beds |
show details | |

|
#40
Hickory St
Edinboro, PA 16412
|
1,136 sq. feet
|
1 baths 3 beds |
show details |
| Photo | Address | Area | Beds / Baths | Price | Details |
|---|---|---|---|---|---|

|
#41
S Main St
Albion, PA 16401
|
1,104 sq. feet
|
1 baths 3 beds |
show details | |

|
#42
Windswept Dr
Mc Kean, PA 16426
|
2,224 sq. feet
|
2 baths 3 beds |
show details | |

|
#43
Plateau Dr
Conneautville, PA 16406
|
- sq. feet
|
1 baths 3 beds |
show details | |

|
#44
Hill Rd
Waterford, PA 16441
|
2,308 sq. feet
|
2 baths 5 beds |
show details | |

|
#45
Route 97 N
Waterford, PA 16441
|
1,140 sq. feet
|
- baths - beds |
show details | |

|
#46
Krider Rd
Meadville, PA 16335
|
- sq. feet
|
- baths - beds |
show details | |

|
#47
Dicksonburg Rd
Conneautville, PA 16406
|
- sq. feet
|
- baths - beds |
show details | |

|
#48
Pine St
Meadville, PA 16335
|
- sq. feet
|
- baths - beds |
show details | |

|
#49
N Main St
Townville, PA 16360
|
- sq. feet
|
- baths - beds |
show details | |

|
Check over 1 million property listings on Foreclosure.com!
|
browse all offers | |||


 | Small towns between Pittsburgh & Erie? (28 replies) |
| Oil City, Pennsylvania (103 replies) |
| Moving to Meadville ... any tips? (69 replies) |
| Johnstown, PA (46 replies) |
Median year apartment built: 1935
Household type by relationship:
Households: 2,263- Male householders: 273 (113 living alone), Female householders: 360 (150 living alone)
208 spouses (208 opposite-sex spouses), 40 unmarried partners, (35 opposite-sex unmarried partners), 407 children (355 natural, 27 adopted, 23 stepchildren), 2 grandchildren, 3 brothers or sisters, 14 parents, 0 foster children, 6 other relatives, 115 non-relatives
- In group quarters: 829
Size of family households: 153 2-persons, 95 3-persons, 42 4-persons, 24 5-persons, 12 6-persons, 18 7-or-more-persons.
Size of nonfamily households: 264 1-person, 60 2-persons.
168 married couples with children.
129 single-parent households (75 men, 54 women).
92.8% of residents of Cambridge Springs speak English at home.
3.4% of residents speak Spanish at home (63% speak English very well, 3% speak English well, 35% speak English not well).
2.7% of residents speak other Indo-European language at home (90% speak English very well, 7% speak English well, 3% speak English not well).
0.3% of residents speak other language at home (100% speak English very well).
Foreign born population: 43 (1.9%)
(93.0% of them are naturalized citizens)
| Here: | 7.0 |
| State: | 6.8 |
| Here: | 3.9 |
| State: | 4.3 |

- Bedrooms in owner-occupied houses and condos in Cambridge Springs, Pennsylvania
- 0no bedroom
- 191 bedroom
- 462 bedrooms
- 1853 bedrooms
- 1084 bedrooms
- 185+ bedrooms

- Bedrooms in renter-occupied apartments in Cambridge Springs, Pennsylvania
- 15no bedroom
- 1331 bedroom
- 782 bedrooms
- 363 bedrooms
- 134 bedrooms
- 265+ bedrooms

- Cars and other vehicles available in Cambridge Springs in owner-occupied houses/condos
- 27no vehicle
- 861 vehicle
- 1872 vehicles
- 543 vehicles
- 194 vehicles
- 35+ vehicles

- Cars and other vehicles available in Cambridge Springs in renter-occupied apartments
- 74no vehicle
- 1331 vehicle
- 882 vehicles
- 23 vehicles
- 04 vehicles
- 35+ vehicles

- Rooms in owner-occupied houses in Cambridge Springs, Pennsylvania
- 01 room
- 82 rooms
- 03 rooms
- 114 rooms
- 375 rooms
- 1046 rooms
- 897 rooms
- 698 rooms
- 589+ rooms

- Rooms in renter-occupied apartments in Cambridge Springs, Pennsylvania
- 151 room
- 122 rooms
- 823 rooms
- 824 rooms
- 295 rooms
- 196 rooms
- 247 rooms
- 38 rooms
- 349+ rooms


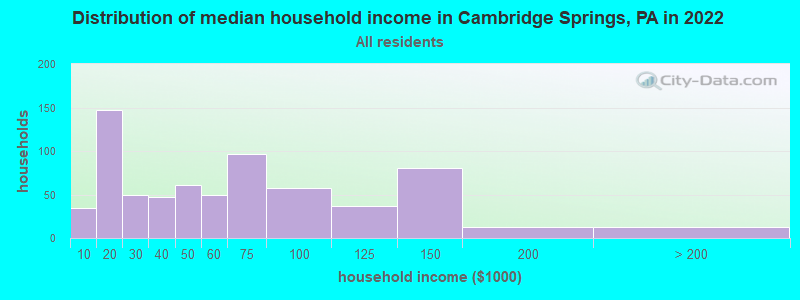
Cambridge Springs, PA household income distribution

- 35Less than $10,000
- 147$10,000 to $19,999
- 50$20,000 to $29,999
- 47$30,000 to $39,999
- 61$40,000 to $49,999
- 49$50,000 to $59,999
- 97$60,000 to $74,999
- 57$75,000 to $99,999
- 37$100,000 to $124,999
- 80$125,000 to $149,999
- 13$150,000 to $199,999
- 13$200,000 or more
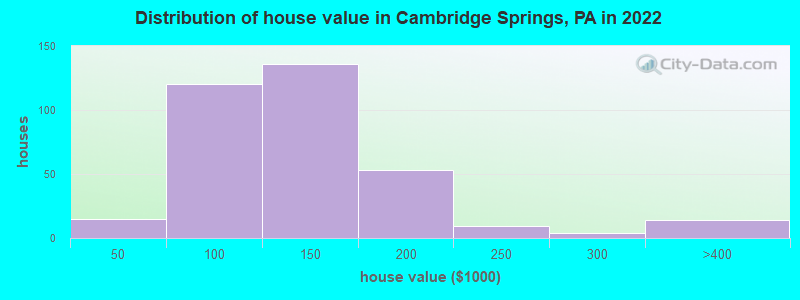
Home value of owner - occupied houses in 2022 in Cambridge Springs, PA
-
- 6$10,000 to $14,999
- 1$30,000 to $34,999
- 6$40,000 to $49,999
- 13$50,000 to $59,999
- 8$60,000 to $69,999
- 36$70,000 to $79,999
- 21$80,000 to $89,999
- 34$90,000 to $99,999
- 109$100,000 to $124,999
- 26$125,000 to $149,999
- 31$150,000 to $174,999
- 21$175,000 to $199,999
- 9$200,000 to $249,999
- 3$250,000 to $299,999
- 14$300,000 to $399,999
Rent paid by renters in 2022 in Cambridge Springs, PA
-
- 15$200 to $249
- 17$300 to $349
- 21$350 to $399
- 61$400 to $449
- 19$450 to $499
- 59$500 to $549
- 28$550 to $599
- 22$600 to $649
- 20$650 to $699
- 13$700 to $749
- 1$750 to $799
- 5$800 to $899
- 3$900 to $999
- 2$1,000 to $1,249
- 45No cash rent


Percentage of workers working in this county: 54.2%
Number of people working at home: 41 (6.0% of all workers)
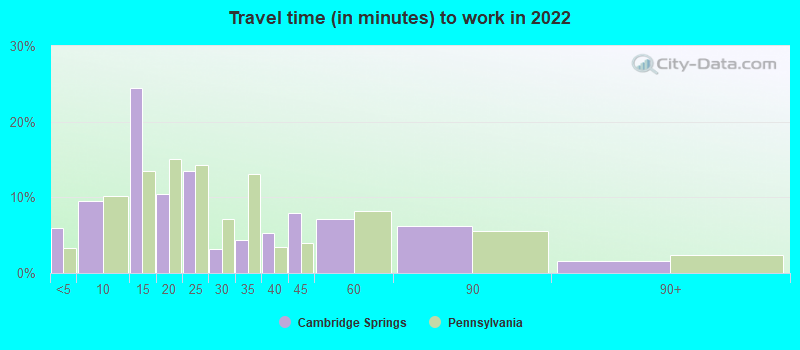
Travel time to work (commute)
- Less than 5 minutes: 49
- 5 to 9 minutes: 49
- 10 to 14 minutes: 55
- 15 to 19 minutes: 108
- 20 to 24 minutes: 97
- 25 to 29 minutes: 34
- 30 to 34 minutes: 87
- 35 to 39 minutes: 34
- 40 to 44 minutes: 30
- 45 to 59 minutes: 42
- 60 to 89 minutes: 75
- 90 or more minutes: 6
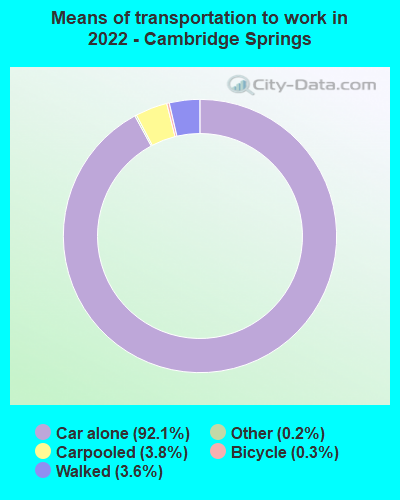
Means of transportation to work:
- Drove a car alone: 866 (86.2%)
- Carpooled: 35 (3.5%)
- Taxi: 2 (0.2%)
- Bicycle: 3 (0.3%)
- Walked: 34 (3.4%)
- Worked at home: 41 (4.1%)

- Unemployment by race in 2022
- Unemployment rate for White non-Hispanic residents
- 6.7%Males
- 3.6%Females

- Year of entry for the foreign-born population in Cambridge Springs, Pennsylvania
- 02010 or later
- 132000 to 2009
- 01990 to 1999
- 41980 to 1989
- 191970 to 1979
- 5Before 1970

First ancestries reported:
- German: 146 (19.1%)
- American: 96 (12.5%)
- Irish: 90 (11.8%)
- Polish: 52 (6.8%)
- Italian: 24 (3.1%)
- English: 23 (3.0%)
- Swedish: 22 (2.9%)
- Welsh: 19 (2.5%)
- Portuguese: 15 (2.0%)
- European: 12 (1.6%)
- Hungarian: 9 (1.2%)
- Pennsylvania German: 6 (0.8%)
- Dutch: 4 (0.5%)
- French: 4 (0.5%)
- Yugoslavian: 4 (0.5%)
- Scottish: 3 (0.4%)
- West Indian: 3 (0.4%)
- British: 2 (0.3%)
- Czech: 2 (0.3%)
- Haitian: 2 (0.3%)
- New Zealander: 1 (0.1%)
- Northern European: 1 (0.1%)
- Ethiopian: 1 (0.1%)
Most common places of birth for foreign-born residents (%):
| Cambridge Springs: | 26.5% (13) |
| Pennsylvania: | 1.3% (12,172) |
| Cambridge Springs: | 24.5% (12) |
| Pennsylvania: | 0.3% (3,185) |
| Cambridge Springs: | 12.2% (6) |
| Pennsylvania: | 0.5% (4,593) |
| Cambridge Springs: | 10.2% (5) |
| Pennsylvania: | 7.2% (67,704) |
| Cambridge Springs: | 6.1% (3) |
| Pennsylvania: | 10.7% (100,596) |
| Cambridge Springs: | 6.1% (3) |
| Pennsylvania: | 1.1% (10,709) |
Place of birth for U.S.-born residents:
- This state: 1,765
- Other state: 407
- Northeast: 129
- Midwest: 87
- South: 153
- West: 28
80.7% of Cambridge Springs residents lived in the same house 1 years ago.
Out of people who lived in different houses, 13.5% lived in this county.
Out of people who lived in different counties, 98.6% lived in Pennsylvania.
| Cambridge Springs: | 80.7% |
| State average: | 89.3% |
Education attainment for males 25 years and older:
- No schooling: 12
- Nursery to 4th grade: 4
- 5th and 6th grade: 0
- 7th and 8th grade: 15
- 9th grade: 0
- 10th grade: 2
- 11th grade: 7
- 12th grade, no diploma: 3
- High school graduate (or equivalency): 173
- Less than 1 year of college: 28
- Some college more than 1 year, no degree: 43
- Associate degree: 37
- Bachelor's degree: 88
- Master's degree: 13
- Professional school degree: 15
- Doctorate degree: 7

Education attainment for females 25 years and older:
- No schooling: 8
- Nursery to 4th grade: 11
- 5th and 6th grade: 0
- 7th and 8th grade: 13
- 9th grade: 39
- 10th grade: 50
- 11th grade: 133
- 12th grade, no diploma: 35
- High school graduate (or equivalency): 623
- Less than 1 year of college: 73
- Some college more than 1 year, no degree: 102
- Associate degree: 46
- Bachelor's degree: 135
- Master's degree: 80
- Professional school degree: 12
- Doctorate degree: 0

Housing units in structures:
- One, detached: 418
- One, attached: 23
- Two: 69
- 3 or 4: 34
- 5 to 9: 49
- 10 to 19: 27
- 20 to 49: 45
- Mobile homes: 2
Housing units lacking complete kitchen facilities in 2022: 8.7%
House/condo owner moved in on average 11 years ago
Renter moved in on average 2 years ago

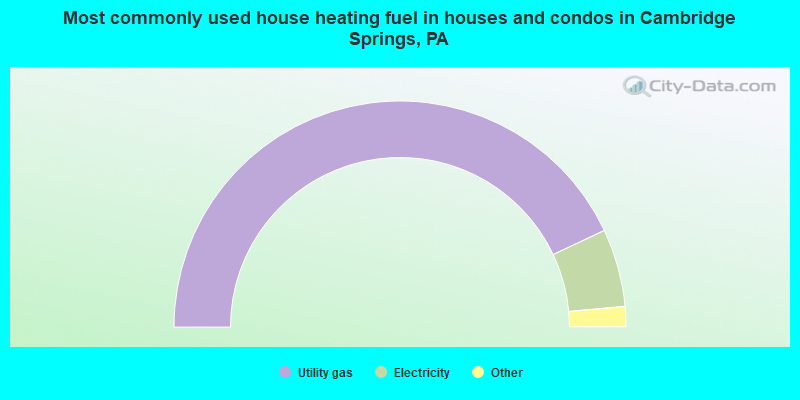
- 86.3%Utility gas
- 11.2%Electricity
- 1.1%Other fuel
- 0.8%Coal or coke
- 0.6%Fuel oil, kerosene, etc.
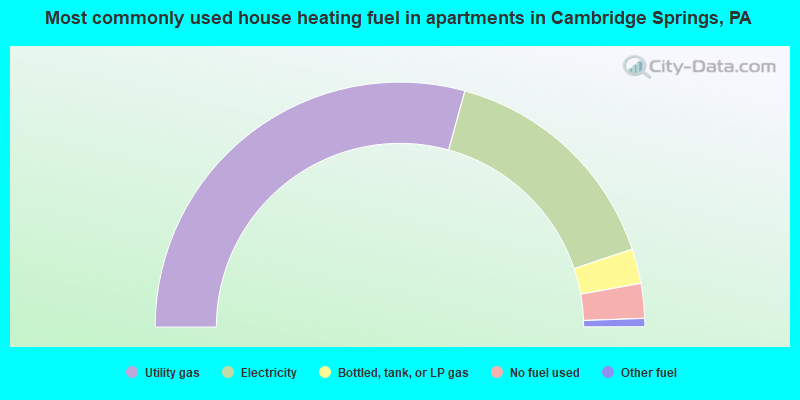
- 58.6%Utility gas
- 31.2%Electricity
- 4.6%Bottled, tank, or LP gas
- 4.6%No fuel used
- 1.1%Other fuel
Private vs. public school enrollment:
| Here: | 13.0% |
| Pennsylvania: | 15.7% |
| Here: | 4.8% |
| Pennsylvania: | 13.4% |
| Here: | 26.4% |
| Pennsylvania: | 39.8% |


